

A marketing data pipeline is the automated system that moves marketing data from its original sources into a form your team can trust for reporting, attribution, and activation. For most teams, the recommended approach is a governed lakehouse built on medallion layers, which separates raw data from the conformed, activation-ready datasets your campaigns depend on. Done well, this gives you one source of truth and features ready for your ad platforms and CRM.
TL;DR:
- Define KPIs, owners, and data contracts before connector work, then build raw staging before transformations to preserve source history and prevent costly recovery.
- Use batch processing for reporting and most attribution; reserve real time pipelines for bidding or in session personalization when an hour’s delay costs value.
- Differential privacy does not protect raw data in storage, so enforce least privilege access, logging, and lineage before sending datasets to ad platforms or CRMs.
- Test conformed datasets for row count anomalies, missing customer or campaign IDs, and invalid joins, then alert on schema drift before faulty metrics reach dashboards.
Table of Contents
- Why marketing teams need pipeline engineering
- Core components of a marketing pipeline
- Architecture patterns and reference designs
- How to design, build, and scale your pipeline
- Batch versus real-time: choosing the right processing model
- Governance, privacy, and implementation cautions
- Measuring whether your pipeline is actually working
- Change management and getting your team to adopt the pipeline
- Data quality management and monitoring best practices
- Bringing AI and ML into your marketing pipeline
- How we approach marketing data pipelines at Brainiac Consulting
- Getting your pipeline built without the guesswork
- FAQ
- Sources
Why marketing teams need pipeline engineering
Marketing teams build pipelines to solve a specific, recurring pain: data lives in a dozen disconnected tools and nobody trusts the numbers that come out of a spreadsheet built from manual exports. A well-built pipeline fixes that by giving every team the same underlying facts.
The practical benefits show up quickly once ingestion and transformation are automated:
- Unified attribution across channels, so ROAS numbers hold up under scrutiny instead of shifting depending on who pulled the report
- Faster, more consistent reporting because analysts stop re-joining the same tables by hand every week
- Reliable audience building for ad platforms and CDPs, since segments are built from conformed, deduplicated records
- Support for LTV modelling, purchase propensity scoring, and cross-channel attribution, all of which need clean, joined data to work at all
A partner analysis on marketing analytics points to meaningfully better returns when teams invest in proper analytics infrastructure rather than treating reporting as an afterthought. That tracks with what we see in practice: the pipeline is rarely the exciting part of a marketing program, but it is almost always the part that determines whether the exciting parts work.
Core components of a marketing pipeline
Every marketing data pipeline, regardless of scale, breaks down into the same functional pieces. Understanding each one helps you assign ownership and pick the right tool for the job instead of forcing one platform to do everything.
- Ingestion: connectors pull data from ad platforms, CRMs, and web analytics, using incremental loads where possible to respect API rate limits and reduce cost.
- Staging or raw layer: incoming records land untouched, with retention policies that let you replay history if a transformation needs fixing later.
- Transform and ELT: raw records become conformed tables, with slowly changing dimensions (SCD) handled explicitly and features engineered for downstream models.
- Storage: a lakehouse suits flexible, large-scale raw and feature data, while a warehouse suits fast, high-concurrency BI queries, and many teams use both.
- Orchestration and observability: scheduled jobs need retries, monitoring, defined SLAs, and lineage tracking so you know what broke and why.
- Activation: conformed, feature-rich datasets flow back out to CDPs, CRMs, and ad platforms, closing the loop with performance feedback.
Pro Tip: Build your raw staging layer before you build anything else. It is the one component you cannot retrofit cheaply once years of unrecoverable source data have already been overwritten.
Architecture patterns and reference designs
Picking an architecture pattern early saves you from rebuilding the foundation six months in. The three dominant patterns each suit a different mix of scale, latency, and team skill.
- A medallion lakehouse organises data into bronze (raw), silver (conformed), and gold (business-ready) layers, which Microsoft’s Fabric documentation describes as a way to preserve lineage from raw source data through to curated analytics-ready models. This layering is what makes governance and trust manageable as pipelines grow.
- A warehouse-first pattern suits teams whose main need is low-latency BI and high-concurrency dashboards, where a traditional warehouse with staged ingestion and orchestration, as shown in Azure’s data warehouse reference architecture, handles reporting loads efficiently without the overhead of a full lakehouse.
- Hybrid approaches use a lakehouse for raw storage and feature engineering, then surface conformed gold datasets into a warehouse or semantic layer for BI tools.
Semantic models and feature stores belong at the boundary between silver and gold: close enough to raw history to stay traceable, far enough upstream that marketing analysts never touch unconformed data directly.
How to design, build, and scale your pipeline
Building a marketing data pipeline works best as a phased rollout rather than a single large project. Each phase has a clear deliverable, which keeps stakeholders aligned and prevents scope creep.
- Phase 0, alignment: define the KPIs the pipeline must serve, assign data owners, write basic data contracts, and set a realistic timeline.
- Phase 1, foundation choices: select your storage layer, orchestration tool, and the first two or three connectors you need most urgently.
- Phase 2, ingestion: build raw staging with explicit schema versioning so upstream changes do not silently break downstream tables.
- Phase 3, conformance: build the conformed datasets, engineer the features your models need, and write tests that catch bad joins before they reach a dashboard.
- Phase 4, operations: add observability, a CI/CD promotion path for pipeline code, access controls, and lineage tracking.
- Phase 5, activation and iteration: push data out to activation endpoints, measure the business impact, and revisit retention and cost settings as volume grows.
Pro Tip: Treat Phase 0 as non-negotiable. Teams that skip straight to connector work almost always end up rebuilding their schema once business stakeholders finally define what “a qualified lead” actually means.
A reasonable first production target for a mid-size team is a single subject-area gold dataset, something like a paid-search-attribution table built from bronze and silver layers, instrumented with automated tests, as outlined in Google Cloud’s marketing analytics jumpstart. Shipping one trustworthy dataset quickly builds the credibility you need to expand scope.
Batch versus real-time: choosing the right processing model
Not every marketing use case needs real-time data, and chasing low latency you do not actually need adds cost and complexity without adding value.
Batch processing remains the right default for most reporting and many attribution windows, since it is cheaper to build, simpler to monitor, and tolerant of occasional delays. Real-time processing earns its cost when the use case is personalization, bidding, or any activation that loses value if it arrives an hour late.
- Batch favours cost predictability and simpler failure recovery, since a failed daily job can usually be re-run without data loss.
- Real-time favours low-latency activation, which matters for dynamic bidding and in-session personalization.
- Operational differences include schema evolution handling, replay strategy, and state management, all of which are harder to get right in streaming systems.
- Decision checklist: assess your actual latency requirement, your cost tolerance, your team’s streaming skills, and whether your connectors even support real-time delivery.
Tools like Apache Spark support both batch and streaming workloads, which is one reason many teams start batch-first and add streaming selectively once a specific use case justifies it.
Governance, privacy, and implementation cautions
Governance is not a layer you add at the end. Security and access control decisions made early determine whether your pipeline can be trusted with sensitive customer data at all.
NIST SP 800-226 makes a point marketing teams often miss: differential privacy does not protect raw data sitting in storage, and a leak of that raw data can nullify downstream privacy guarantees entirely. Privacy-enhancing techniques are complements to strong access controls, never substitutes for them.
A connector-level trap worth flagging specifically: when ingesting Salesforce Marketing Cloud data, Azure Databricks documentation notes that the connector requires the External Key, not a display name, as the source_table, and may auto-add a hash-based primary key that blocks standard SCD Type 2 historization unless you handle it explicitly upstream.
Before activating any dataset to an ad platform or CRM, run through this checklist:
- Confirm least-privilege access controls on every raw and conformed table
- Verify logging and lineage are active for the specific dataset being activated
- Check that connector-specific keys and identifiers are mapped correctly
- Schedule periodic audits rather than relying on a one-time review
Measuring whether your pipeline is actually working
A pipeline’s value only becomes real once you measure it against business outcomes, not just uptime. The right metrics split into technical health and business impact.
On the technical side, track pipeline latency (how long from source event to available dataset), job success rate, schema drift incidents, and data freshness against your defined SLA. These tell you whether the engineering is sound.
On the business side, the metrics that matter to marketing leadership include:
- Attribution consistency: does ROAS reported by the pipeline match, within a reasonable tolerance, what finance later reconciles
- Time to insight: how long it takes an analyst to go from question to answer, which should shrink significantly once manual joins disappear
- Activation lift: measurable improvement in campaign performance after audiences or features sourced from the pipeline replace manually built lists
- Data trust score: a simple internal survey metric tracking whether marketing stakeholders actually believe the numbers they are shown
Pipeline velocity, the rate at which new data sources or use cases can be onboarded, is itself a useful KPI. A pipeline that takes three months to add a new ad platform connector is signalling an architecture problem, not just a staffing one. Teams that track these metrics from day one catch degradation early, before a broken join quietly skews a quarter’s reporting.
Change management and getting your team to adopt the pipeline
The hardest part of a pipeline project is rarely the engineering. It is getting marketers, analysts, and sales operations to actually trust and use the new system instead of falling back on familiar spreadsheets.
Successful adoption tends to follow a few consistent patterns. Start by identifying the analysts and marketers who feel the current pain most acutely, since they become natural champions once the new pipeline solves a problem they already recognize. Give them an early look at the first conformed dataset, framed as a pilot rather than a finished product, so feedback shapes the build instead of arriving after launch.
Documentation matters more than most technical teams expect. A short data dictionary explaining what each gold table contains, who owns it, and how fresh it is removes the guesswork that otherwise sends people back to manual exports. Training sessions work best when they are tied to a specific, immediate task, like building this month’s campaign report, rather than a general walkthrough of the new system.
Expect a transition period where both the old manual process and the new pipeline run in parallel. This is not wasted effort. It is how stakeholders build confidence that the numbers match before they are willing to retire the spreadsheet for good. Set a clear sunset date for the legacy process so parallel running does not become permanent, and revisit ownership roles once the pipeline stabilizes, since the person who built it is not always the right person to maintain it long term.

Data quality management and monitoring best practices
A pipeline that runs reliably but produces subtly wrong numbers is more dangerous than one that fails loudly, because nobody notices until a decision has already been made on bad data.
Build data quality checks directly into the transformation layer rather than treating them as a separate audit step. Useful checks include row count anomaly detection between loads, null rate thresholds on critical fields like customer ID or campaign ID, and referential integrity checks that confirm every fact table row joins to a valid dimension. Observability-focused guidance for engineering teams emphasizes catching these issues close to the source, since problems caught at ingestion are far cheaper to fix than problems discovered three transformation layers downstream.
Monitoring should cover both the pipeline’s mechanical health and the shape of the data itself. Job failures and missed SLAs are the obvious signals, but schema drift, for example an upstream platform silently renaming a field, is the kind of failure that breaks a pipeline quietly rather than loudly. Set alerts on both.
A few practices worth standardizing:
- Version every schema change and keep a changelog accessible to analysts, not just engineers
- Run automated tests on every conformed dataset before it is promoted to production
- Log data lineage so a bad number can be traced back to its source table within minutes, not days
- Review data quality metrics on a recurring cadence, not only when something visibly breaks
Bringing AI and ML into your marketing pipeline
Predictive analytics, things like purchase propensity scoring or churn prediction, depends entirely on the quality of the feature data your pipeline produces. Models built on inconsistent or stale features tend to degrade quietly, often without anyone noticing until performance drops.
The most reliable approach is to treat feature engineering as a pipeline responsibility, not a separate step the data science team handles in isolation. Features should be computed once, in the silver-to-gold transformation layer, and reused consistently across every model that needs them. This avoids the common problem of two teams calculating “customer lifetime value” two different ways and getting two different answers.
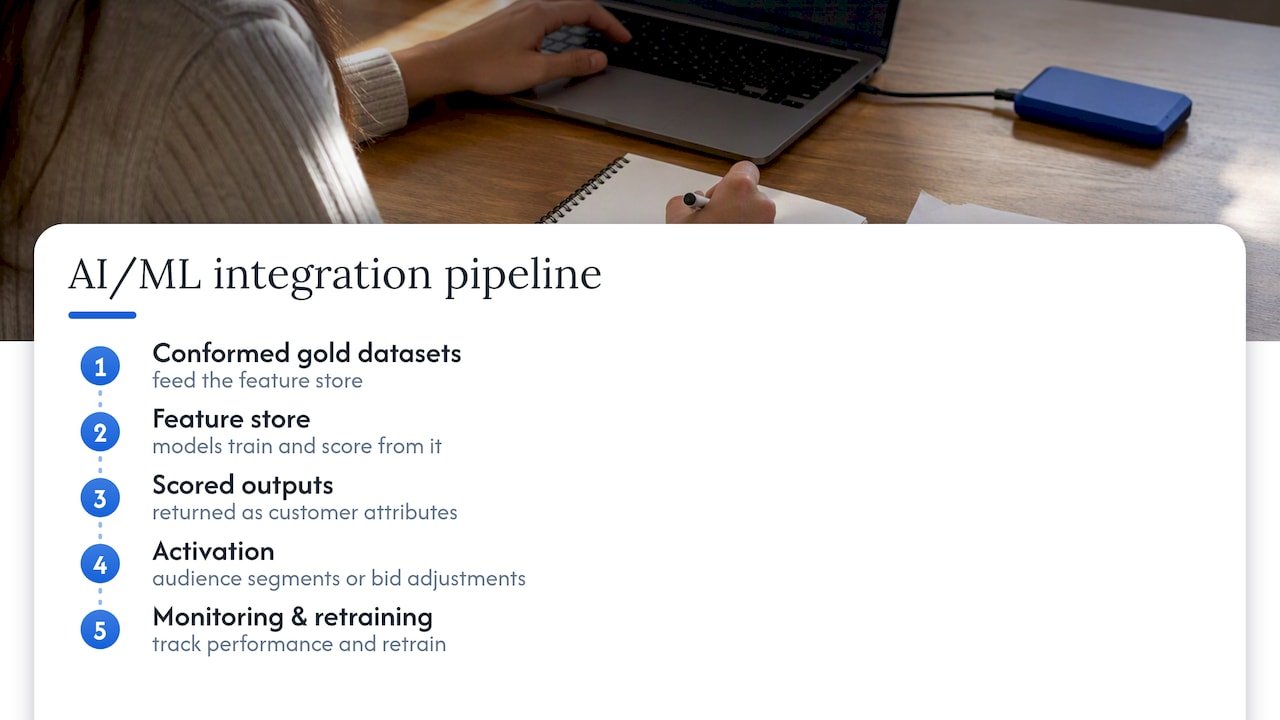
A practical integration pattern looks like this: conformed gold datasets feed a feature store, models train and score against that feature store, and scored outputs (a propensity score, a predicted LTV band) flow back into the pipeline as new attributes on the customer record. Those attributes then become available for activation, letting a model’s output directly drive an audience segment or a bid adjustment without manual handoff.
Retraining cadence matters as much as the initial build. A propensity model trained once and left untouched will drift as campaign mix and customer behaviour shift. Building a lightweight monitoring step that tracks model performance against actual outcomes lets you catch that drift before it affects live campaigns, rather than after a quarter of underperforming spend.
How we approach marketing data pipelines at Brainiac Consulting
We build marketing data pipelines using an open-source-first methodology, with integrations into platforms so clients retain visibility into how their data moves and transforms. Our engagements typically move through an assessment, a focused pilot, and a production rollout, followed by ongoing managed operations. That sequence tends to produce faster activation timelines and attribution teams can rely on.
— Don
Getting your pipeline built without the guesswork
If your team recognizes the gap between the pipeline you have and the one described above, we can close it without you having to hire and manage a data engineering function from scratch. Our marketing operations optimization and support service covers exactly this kind of build, from ingestion through activation, and our AI-enabled analytics work layers predictive models on top once the foundation is solid.
What we typically recommend as a starting point:
- A short assessment to map your current data sources, gaps, and priority use cases
- A pilot pipeline covering one or two high-value datasets, built on the architecture patterns covered above
- A path to production with the governance and monitoring already built in, not bolted on afterward
If you are further along and already running agents or automation in your marketing stack, our Agentic AI Enablement and Custom Agent Deployment services extend the same pipeline into automated decisioning. Visit Brainiac Consulting to book an assessment and see which starting point fits your current data maturity.
FAQ
What is a marketing pipeline?
A marketing pipeline, in the data sense, is the automated system that moves marketing data from source platforms like ad networks, CRMs, and web analytics into conformed, activation-ready datasets. In a sales context the same term can mean the stages a lead moves through before becoming a customer, so context matters when you hear it used.
What are examples of data pipelines?
Common examples include an ingestion pipeline pulling ad spend data into a warehouse, an ETL pipeline that cleans and joins CRM and web analytics data, and a real-time streaming pipeline that feeds personalization engines during an active browsing session. Marketing teams typically run several of these in parallel, each serving a different reporting or activation need.
What are the three types of pipelines?
Pipelines are usually grouped by processing model: batch pipelines that run on a schedule, real-time or streaming pipelines that process events as they occur, and hybrid pipelines that combine both for different datasets within the same system. The right type depends on how quickly your use case needs the data to be usable.
What are the five steps of a data pipeline?
A typical data pipeline moves through ingestion, staging or raw storage, transformation, storage of the conformed result, and activation or delivery to the systems that use it. Orchestration and monitoring run alongside all five steps rather than being a separate stage.
Sources
- Guidelines for Evaluating Differential Privacy Guarantees (NIST SP 800-226)
- Medallion lakehouse architecture (Microsoft Fabric docs)
- Marketing Analytics Jumpstart (GoogleCloudPlatform GitHub)