

Marketing reporting automation is the practice of pulling campaign and revenue data from your platforms, transforming it into consistent metrics, and delivering that analysis to stakeholders without a person building the deck by hand. Done right, it hands your analysts back their week and gets decisions made on Tuesday instead of the following month. The first move isn’t picking software. It’s mapping three KPIs that tie directly to revenue and putting one report on an automated schedule.
TL;DR:
- Automating marketing reports reduces manual effort, accelerates decision-making, and improves data accuracy through consistent transformations and scheduled deliveries.
- Most pipelines involve connecting data sources, storing raw data, transforming it into standardized metrics, and automating dashboards or reports, with common failure points in API limits, schema changes, and stale refreshes.
- KPIs should be directly linked to revenue and tailored to each stakeholder role, with dashboards typically focusing on pipeline, customer acquisition cost, return on ad spend, and retention metrics.
- Building a reliable system requires mapping core KPIs upfront, assigning data ownership, and implementing governance measures like schema validation and version control before full scaling.
- Using phased implementation, a small initial pilot, alongside tools like connectors, warehouses, BI platforms, and narrative automation, minimizes risk and maximizes ROI.
Table of Contents
- What does marketing reporting automation actually do?
- How does the reporting pipeline actually work?
- Which KPIs actually deserve a dashboard?
- Which tool category actually fits your team?
- How do you actually build this, step by step?
- What does this cost, and how do you justify it?
- Why do automation projects fail, and how do you prevent it?
- How does Brainiac Consulting approach marketing reporting automation?
- What cadence and format should your reports actually use?
- How do you keep marketing data secure and compliant?
- What I’ve learned building these systems
- How Brainiac Consulting can build this with you
- Sources
- FAQ
What does marketing reporting automation actually do?
At its core, marketing reporting automation handles four jobs: it collects data from your ad platforms, CRM, and web analytics; transforms that raw data into standardised metrics; visualises it in dashboards or documents; and delivers it to the right person at the right cadence. Nobody is exporting spreadsheets from four platforms every Monday morning anymore.
The gains show up in three places. Speed is the obvious one. Teams that move from monthly to weekly or daily measurement cycles can test more campaign elements and reallocate budget while a campaign is still running, not after it’s closed, according to HubSpot’s analysis of high-performing marketing teams. Accuracy is the quieter win. When a transformation layer applies the same currency conversion, attribution window, and channel taxonomy every single time, you stop debating whose spreadsheet is right in the Monday meeting. And then there’s time. An analyst who used to spend twelve hours a month stitching together a board deck can spend that time investigating why paid social conversion rates dropped, instead.
Different roles benefit differently:
- Analysts get freed from manual data pulls and can focus on interpretation instead of extraction.
- Campaign owners see performance daily instead of waiting for a scheduled review, so they can pause underperforming ads faster.
- CMOs get a consistent, revenue-linked view across channels without asking five people for five versions of the truth.
- Finance teams get marketing spend and outcomes reconciled against the same numbers everyone else uses.
Pro Tip: In the first 90 days, don’t try to automate everything. Pick one report that currently takes someone a full day to build by hand, automate that one first, and use the time saved to build momentum for the next.
How does the reporting pipeline actually work?
Every automated marketing reporting system follows the same basic architecture, whether you’re running it on a handful of spreadsheets or an enterprise data stack. Data moves through six stages, and understanding each one tells you exactly where things tend to break.
Connectors and ingestion come first. These pull data from ad platforms, your CRM, your web analytics tool, and increasingly offline conversion data like store visits or phone leads. Scheduled extracts run on a timer, usually hourly or daily, rather than someone clicking “export” when they remember to.
Storage holds that raw data somewhere queryable, typically a cloud warehouse. This is the layer most teams skip when they’re small, piping data straight into a spreadsheet instead. That works until you have more than two data sources, at which point the spreadsheet becomes the bottleneck.
Transformation is where raw exports become usable metrics. Currency gets standardised, campaign names get mapped to a consistent taxonomy, and attribution rules get applied. This is also where a semantic or model layer lives, the set of business definitions that says “return on ad spend means this calculation, applied this way, every time.”
Reporting and delivery is the visible layer: dashboards, scheduled documents, and narrative summaries sent to inboxes or Slack channels.
Automation tasks map cleanly to each stage:
| Pipeline stage | Automation task | Typical failure point |
|---|---|---|
| Connectors/ingestion | Scheduled extracts, API polling | Rate limits, expired tokens |
| Storage | Automated loading jobs | Schema drift from source platforms |
| Transformation | Orchestrated transform jobs, version-controlled logic | Silent logic errors, untested changes |
| Semantic/model layer | CI testing for metric definitions | Metric drift across reports |
| Dashboards & narrative | Auto-refresh, AI-assisted summaries | Stale caches, broken visualisations |
| Delivery/alerts | Scheduled sends, threshold alerts | Missed recipients, alert fatigue |
Integration notes matter here. Connect your CRM (Salesforce or HubSpot, most commonly) so that pipeline stages tie back to actual revenue, not just clicks and impressions. Bring in offline conversion data if a meaningful share of your sales close outside digital channels, phone calls, in-store visits, or sales-assisted deals. And treat first-party data (your own CRM, email platform, and website analytics) as the backbone of your model, since third-party signal loss keeps eroding what platforms report natively. Connecting GA4 to CRM data and choosing an attribution model that fits your actual sales cycle is one of the more overlooked steps in this stage.
Which KPIs actually deserve a dashboard?
Vanity metrics look good in a slide and mean almost nothing to a CFO. Impressions, likes, and even raw click-through rate tell you activity happened, not whether it moved revenue. Research on KPI selection is consistent on this point: pick a focused set of metrics that connect to business outcomes, and resist the urge to track everything just because you can, according to Harvard Business School’s guide to marketing KPIs.
The trick is mapping metrics to the person reading them. A CMO doesn’t need channel-level cost-per-click. A paid media manager doesn’t need customer lifetime value by cohort. Ahrefs’ breakdown of marketing KPIs by role makes the case that different jobs need different KPI bundles entirely, not a shared dashboard with everything on it.
A workable starting bundle by audience:
- Executive north star: pipeline generated, customer acquisition cost, marketing-sourced revenue.
- Paid channel: return on ad spend, cost per qualified lead, conversion rate by campaign.
- Content: organic traffic to lead conversion rate, assisted conversions, time to rank.
- Retention: churn rate, expansion revenue, net promoter score trend.
From there, two templates cover most needs. The executive report runs monthly or bi-weekly, three to five KPIs, one paragraph of narrative context, and a trend line, nothing more. The channel report runs weekly, drills into cost, volume, and conversion by campaign, and flags anomalies automatically rather than making a human eyeball a spreadsheet for outliers.
| Template | Cadence | Core metrics | Where automation adds the most |
|---|---|---|---|
| Executive summary | Monthly/bi-weekly | Pipeline, CAC, marketing-sourced revenue | Narrative generation, anomaly flagging |
| Channel performance | Weekly | ROAS, CPL, conversion rate | Data refresh, threshold alerts |
Which tool category actually fits your team?
Vendor shopping before you understand your own architecture is the single most common way teams overspend or under deliver on marketing reporting automation. Five categories cover the space, and each solves a different problem.
Connectors and ETL tools pull data out of platforms like Google Ads, Meta, and your CRM into a central location. If you’re duct-taping together CSV exports, this is your first purchase. Data warehouses store that raw and transformed data at scale, and matter once you’re combining more than two or three sources. Transformation and semantic layers turn raw tables into consistent metric definitions, the layer that stops three people from calculating “conversion rate” three different ways. BI tools build the dashboards and visual layer people actually look at. Report delivery and narrative automation tools handle the scheduled PDF, the Monday email, and increasingly an AI-written summary paragraph explaining what changed and why.
Deciding which categories you need depends on scale and skill, not ambition:
- A five-person marketing team with one analyst probably needs a connector tool plus a BI tool and can skip a dedicated warehouse entirely.
- A team running attribution across ten-plus channels and a real sales cycle needs a warehouse and a semantic layer, or metric drift will quietly poison every report.
- An enterprise operation with compliance requirements needs monitoring and governance tooling as a first-class category, not an afterthought bolted on later.
Watch for red flags regardless of scale. Closed data ownership, where a vendor holds your transformed data hostage in a proprietary format, will cost you dearly the day you want to switch. Fragile connectors that break every time a platform changes its API design mean someone spends Friday afternoons firefighting instead of analysing. And limited scheduling flexibility, tools that only support daily refreshes when your paid media team needs hourly visibility during a launch, will force workarounds that undermine the entire automation effort. Resources like AmmarAI’s guide to AI for marketing teams are worth a look if you’re weighing how much of the analysis layer itself can be AI-assisted versus manually configured.
How do you actually build this, step by step?
Before touching a single tool, run a readiness check. Confirm you’ve mapped your three to five core KPIs, assigned an owner for each data source, and inventoried what data actually exists versus what you assume exists. Half the automation projects that stall do so because nobody checked whether the CRM field they need was even being populated consistently.
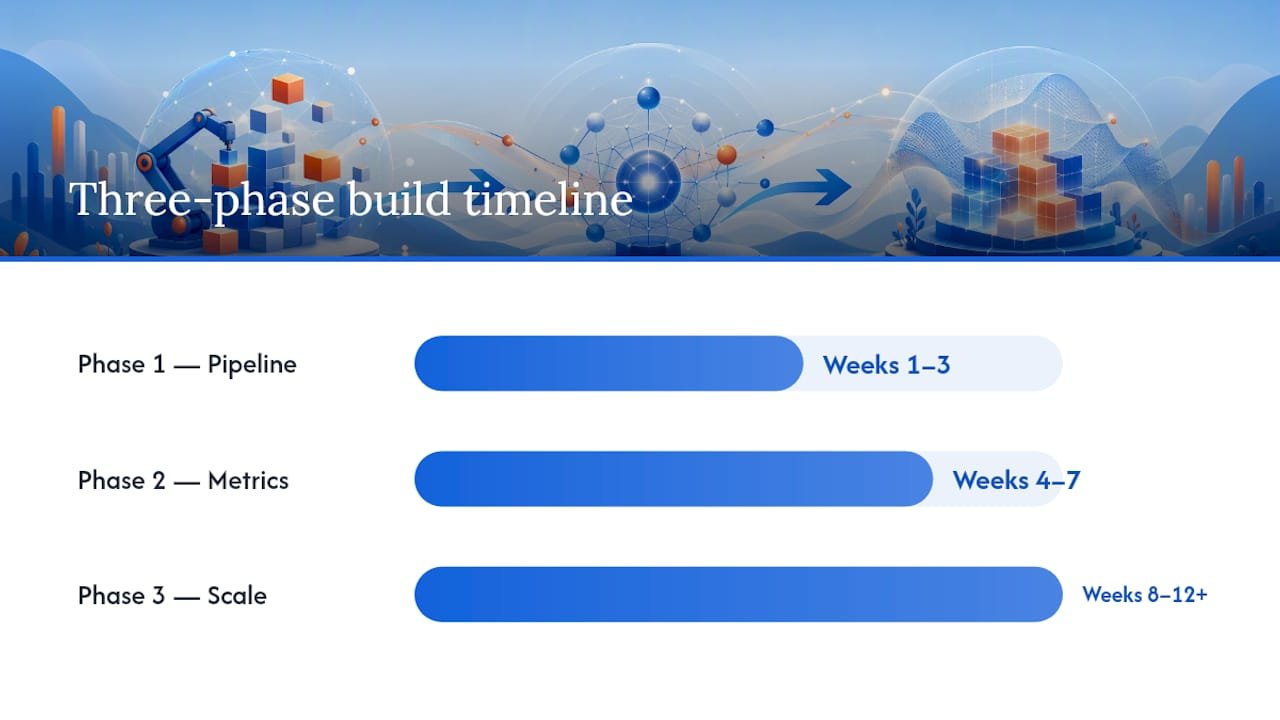
From there, a three-phase build works for most teams:
- Phase one (weeks 1 to 3): prove the pipeline. Pick one data source, build one working extract-transform-load flow, and land it in a single warehouse table. Don’t build the dashboard yet. Prove the data arrives clean and on schedule first.
- Phase two (weeks 4 to 7): build canonical metrics. Define your metric logic once (how you calculate ROAS, how you attribute a conversion) and build a single dashboard against it. This is where the semantic layer earns its keep, since every future report inherits these definitions instead of reinventing them.
- Phase three (weeks 8 to 12 and ongoing): schedule, add narrative, scale. Automate delivery, layer in AI-assisted narrative summaries, add governance checks, and expand to additional data sources and reports.
Following a phased structure like this, rather than trying to automate every report simultaneously, is consistent with practitioner guidance on rolling out marketing report automation gradually to reduce risk.
Three roles carry this project: an analyst who owns metric definitions and interpretation, an engineer who owns the pipeline and connector reliability, and a business owner who signs off on what “done” looks like. Acceptance testing should be concrete: does the automated number match a manual calculation within an agreed tolerance, does the report arrive on schedule for two consecutive cycles, and can a stakeholder read the output without needing a follow-up explanation?
Pro Tip: Run your first automated report in parallel with the manual version for two full cycles before retiring the manual process. Discrepancies show up fast, and trust in the new system depends entirely on catching them before a CMO does.
What does this cost, and how do you justify it?
Budget planning for marketing reporting automation breaks into four cost drivers: connector or ETL tooling, warehouse storage and compute, BI licensing, and the engineering time to build and maintain the pipeline. That last one gets underestimated constantly. A pipeline isn’t a one-time build; platforms change their APIs, and someone needs to own the fixes.
A simple ROI formula covers most business cases: (hours saved per month × loaded hourly rate) + estimated value of faster decisions = monthly return. If an analyst currently spends 20 hours a month on manual report assembly at a loaded rate of $60 an hour, that’s $1,200 in reclaimed time alone, before accounting for the value of catching an underperforming campaign three weeks earlier than a monthly review would have.
Faster decision cycles compound this. Teams that measure weekly or daily can reallocate budget and test more frequently, and that speed advantage rarely shows up cleanly in a single spreadsheet formula, which is exactly why the direct time savings alone are usually enough to justify the first phase of investment.
Why do automation projects fail, and how do you prevent it?
Most marketing reporting automation projects don’t fail loudly. They fail quietly, when someone stops trusting the dashboard and goes back to building a manual spreadsheet on the side. Four failure modes account for nearly all of it.
- API limits and connector failures. Platforms throttle or change their APIs without much warning. Build in retries, exponential backoff, and automated health checks that flag a failed extract within hours, not weeks.
- Schema changes and missing fields. A platform renames a field or adds a new campaign type, and your transformation logic silently breaks or misreports. Automated schema diffing catches this before a stakeholder notices numbers look wrong.
- Attribution errors. Changing your attribution model without versioning it means historical comparisons become meaningless. Keep validation datasets and version every model change so you can explain a shift when someone asks why last quarter’s numbers moved.
- Stale refreshes. A dashboard that looks fine but hasn’t actually refreshed in three days is worse than an honest error message. End-to-end observability, checking not just that a job ran but that fresh data actually landed, catches this before it erodes trust.
Data quality has to be treated as infrastructure, not an afterthought, because governance and automated checks are what separate a dashboard people trust from one they quietly stop using.
How does Brainiac Consulting approach marketing reporting automation?
Brainiacconsulting builds automation around three layers instead of a single dashboard tool: governed data connectors, a canonical metric model, and AI-assisted narrative delivery, all operated under a client’s own data ownership rather than being locked into a proprietary black box. The open-source connector philosophy means clients keep visibility into exactly how a metric got calculated, which matters enormously the first time a board member asks why a number changed.
The phased rollout mirrors what disciplined teams do internally, just with dedicated hands on the pipeline:
- Connect priority platforms (commonly Salesforce, HubSpot, and Marketo) with governed, monitored connectors rather than fragile point solutions.
- Build canonical KPI definitions once, so every downstream report inherits the same attribution logic and terminology.
- Layer in AI-assisted narrative summaries that explain what changed and why, not just what the number is.
- Run pilots with clear stakeholder onboarding before scaling to a full managed operation, so governance is built in from day one rather than retrofitted later.
Engagements built this way have contributed to pipeline growth and faster insight cycles for clients across sectors, without requiring teams to abandon the platforms they already run on.
What cadence and format should your reports actually use?
Cadence should follow decision speed, not habit. If a channel manager can act on a signal today, a monthly report is actively working against the business. Weekly or even daily dashboards fit fast-moving paid channels, while monthly or quarterly formats suit board-level, strategy-oriented reporting where the audience needs trend context more than daily noise.
Three formats cover nearly every use case. Live dashboards suit anyone who needs to check performance on demand, campaign managers during an active launch, for instance. Scheduled PDFs or documents suit stakeholders who want a consistent, archivable snapshot delivered to their inbox on a fixed day, useful for board packets and monthly client updates. Email narratives, often now AI-generated, summarise what changed and why in plain language, which matters because a chart alone doesn’t tell a CFO whether a dip is a problem or a seasonal blip.
The trend toward automated narrative generation, tools that write a short paragraph explaining performance shifts alongside the visual, has become one of the more visible ways agencies and internal teams scale reporting without scaling headcount. The format should match the reader’s attention span: an executive skimming an inbox needs three sentences and a number, while an analyst investigating a problem needs the full dashboard with drill-down capability. Building both from the same underlying metric model, rather than maintaining two separate reporting systems, is what keeps the numbers consistent between the two audiences.
How do you keep marketing data secure and compliant?
Marketing reporting automation touches customer data constantly, email addresses, purchase history, sometimes payment signals, which makes security and compliance a design requirement, not a checkbox added at the end.
Start with access control. Not every stakeholder needs raw customer-level data; most need aggregated metrics. Role-based access at the warehouse and dashboard layer limits exposure without slowing down the people who genuinely need detail. Data residency and retention policies matter too, particularly if your customer base spans regions with different privacy rules; automated pipelines need retention rules built into the transformation layer, not enforced manually after the fact.
Third-party connector security deserves scrutiny most teams skip. Every connector with API access to your CRM or ad platforms is a potential exposure point, so vetting how a vendor stores credentials and whether they support token rotation isn’t optional due diligence, it’s basic risk management. Audit trails matter as well: when a metric definition changes or a report goes out with different numbers than last month, being able to trace exactly what changed and who approved it protects both trust and, in regulated industries, compliance standing.

None of this should feel like it’s fighting against the automation itself. Built correctly, governance checks run in the background the same way schema validation does, catching problems before a stakeholder ever sees a wrong number.
What I’ve learned building these systems
Scope control is the lesson that costs teams the most when they skip it. Every automation project I’ve seen struggle tried to connect every data source and build every dashboard in phase one. The projects that actually stick automate one report end to end, prove it’s trustworthy, and only then expand. Governance is the second lesson, and it’s less glamorous: a canonical metric definition, agreed and documented before the first dashboard ships, prevents more damage than any amount of clever visualisation ever will.
If I were starting a new automation project tomorrow, three things would come first. Map the KPIs to actual business outcomes before opening a single tool. Assign a named owner to every data source, because unowned data rots quietly. And build the governance layer, schema checks, versioned metric definitions, alongside the pipeline, not after something breaks.
— Don
How Brainiac Consulting can build this with you
If the architecture above sounds right but your team doesn’t have the bandwidth to build and maintain it, that’s precisely the gap Brainiacconsulting closes. Rather than handing you another dashboard tool to configure yourself, Brainiacconsulting designs, builds, and operates the entire pipeline, connectors, governed metric models, and AI-assisted narrative delivery, so your analysts spend their time on decisions instead of data plumbing.
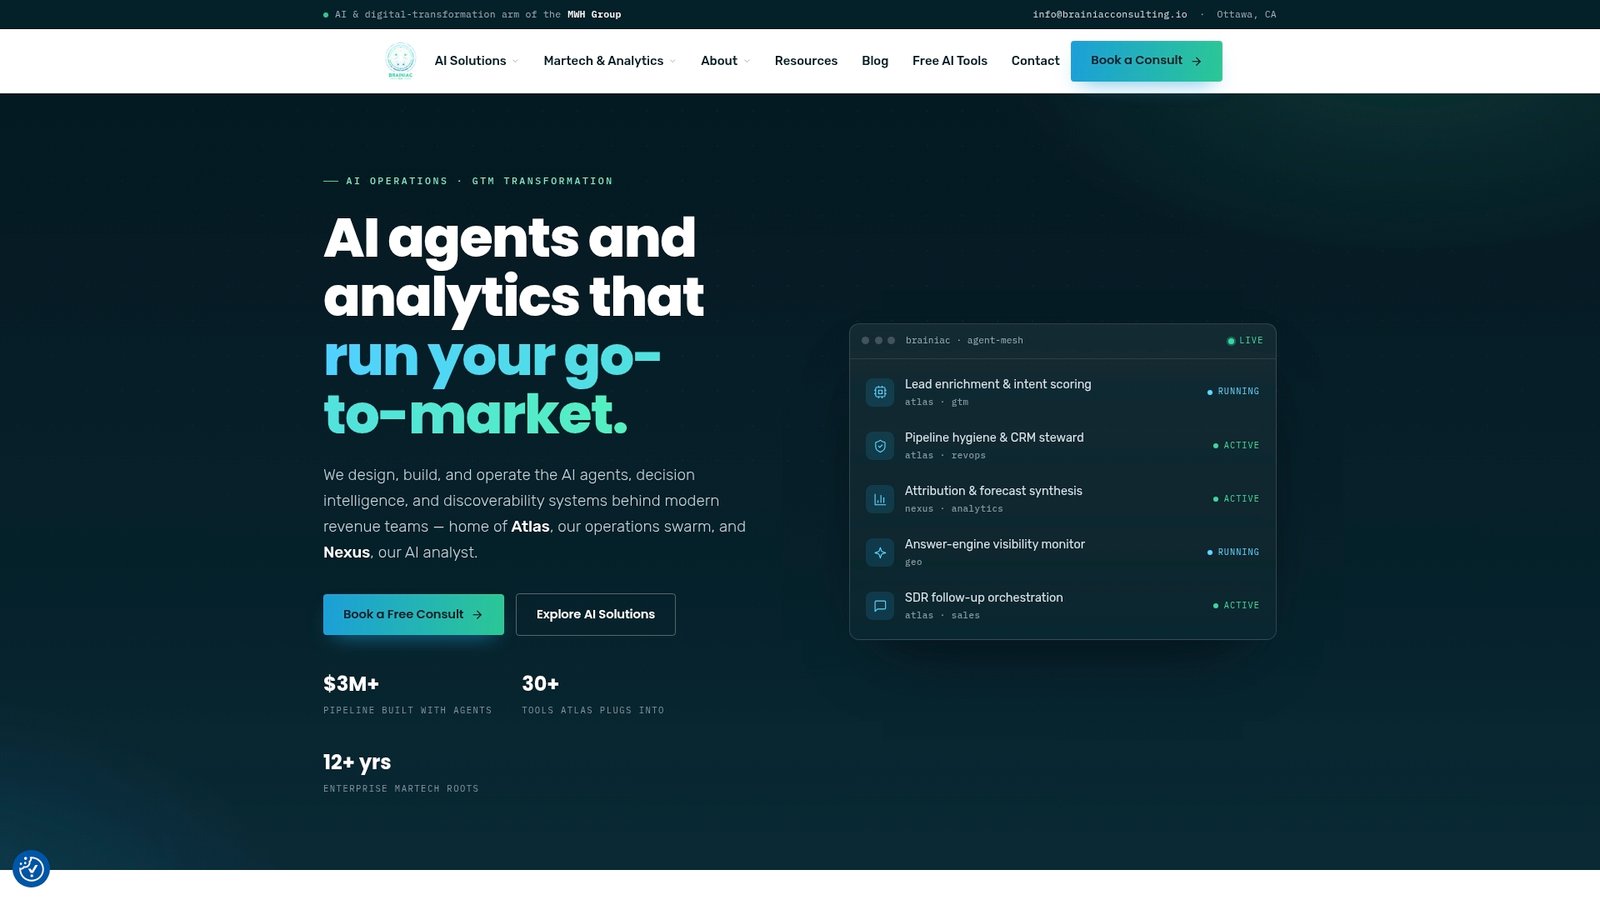
The path is straightforward: an audit of your current data sources and KPI gaps, a focused pilot proving one automated report end to end, then a managed operation that scales as your reporting needs grow. Integrations span Salesforce, HubSpot, Marketo, Power BI, and Tableau, so existing platform investments stay in place rather than getting replaced. The Atlas AI Operations platform is where this comes together, governed connectors and analytics built for teams that need revenue-linked reporting without building an internal data engineering function from scratch. Explore the case studies showing how this has played out for other marketing and revenue teams, then reach out to scope a pilot for your own reporting stack.
Sources
- Marketing KPIs: how to choose the right marketing metrics
- Data quality — Gartner
- How successful marketing teams are optimizing performance in 2026 (and what metrics they’re tracking)
- Marketing KPIs: 30 metrics for every marketing role
FAQ
What is marketing reporting automation?
It’s the process of automatically collecting marketing data from platforms and CRMs, transforming it into standard metrics, and delivering dashboards or reports on a schedule without manual spreadsheet work.
How long does it take to automate marketing reports?
A focused first phase, proving one automated report end to end, typically takes two to three weeks; a full canonical metric model and scheduled delivery system usually takes eight to twelve weeks depending on data source complexity.
What tools do I need to start automating marketing reports?
At minimum, a connector or ETL tool to pull platform data and a BI tool to visualise it; teams combining three or more data sources typically add a warehouse and a transformation layer for consistent metric definitions.
How do I choose the right KPIs for automated reporting?
Pick three to five metrics that tie directly to revenue outcomes for each stakeholder group, rather than tracking every available metric, and assign clear ownership for each one.
Can Brainiac Consulting help build a custom reporting automation system?
Yes. Brainiacconsulting designs, builds, and operates governed reporting pipelines integrated with platforms like Salesforce, HubSpot, and Marketo, and phases pilots before scaling to a fully managed operation.