

Multi-touch forecasting predicts revenue by weighting every tracked buyer interaction, not just the last click or the sales stage a rep typed into the CRM. It measurably sharpens forecast accuracy once a company has clean event data and identity resolution in place, according to Salesforce’s own forecasting research. Specialist consulting firms design these systems for revenue teams who are tired of forecasts that miss by 20 points every quarter.
TL;DR:
- Multi-touch forecasting improves accuracy by weighting all buyer interactions, but requires clean event data, identity resolution, and a unified data layer.
- Last-click attribution severely misrepresents buyer journeys, especially with complex, non-linear, multi-stakeholder sales processes.
- Building reliable models involves disciplined data capture, normalization, and regular retraining based on consistent key metrics like MAPE and RMSE.
- Combining multiple models into ensembles, along with explicit governance and clear ownership, enhances forecast trustworthiness and operational value.
- Implementing a phased, objective-driven approach with proper data foundation, model validation, and stakeholder alignment minimizes risks and accelerates value realization.
Table of Contents
- Why traditional pipeline forecasting fails
- Core components and data foundation for reliable multi-touch forecasting
- What behavioural signals actually predict pipeline movement?
- Which model approach fits your forecast?
- How do you build a multi-touch forecasting playbook?
- What metrics prove your forecast is actually working?
- Operational considerations: governance and integration
- Brainiac Consulting: an open-source, integrated approach to multi-touch forecasting
- Turning a forecast into a decision
- What tools support multi-touch forecasting deployments?
- How do you keep a forecasting model accurate over time?
- A practitioner’s view on timelines and pitfalls
- How Brainiac Consulting can help you build this
- Sources
- FAQ
Why traditional pipeline forecasting fails
Stage-based forecasting was built for a world where a handful of touchpoints led to a sale. That world is gone. Today’s buying committees average multiple stakeholders who research independently, compare vendors quietly, and only surface in the CRM once a rep manually logs a “stage change.” That single fact explains most of what goes wrong with pipeline forecasting in 2026.
The core problem is subjectivity. Forecast-category rollups depend on that same feeling being roughly consistent across a sales floor of people who have never agreed on what “commit” actually means. Add latency (deals get updated weekly, sometimes monthly) and missing signals (nobody logs the fact that a champion just left the company), and you have a forecasting model built on stale, biased inputs.
Last-click attribution compounds the damage. If a prospect reads eleven blog posts, attends a webinar, downloads a pricing guide, and then fills out a demo form, last-click credit hands the entire win to that final form fill. Every earlier touch that actually built the intent gets zero weight. That distortion doesn’t just misallocate marketing budget. It teaches your forecasting model the wrong lesson about what causes deals to close.
Real buyer journeys are non-linear. Forrester’s research on business buying confirms that multi-stakeholder buying groups now research in parallel, loop back to earlier content, and re-engage after apparent silence. Stage-based models treat this as noise. Behaviour-driven multi-touch forecasting treats it as signal, because it is.
The practical consequences of ignoring this show up as forecast bias in predictable ways:
- Deals that “stall” in a stage for weeks often show strong background engagement that CRM fields never capture.
- Reps sandbagging or over-forecasting skews the whole team’s number, and nobody can tell which is happening from stage data alone.
- Marketing-sourced pipeline gets under-credited because attribution stops counting the moment a rep takes over the deal.
- Seasonal and campaign effects (a product launch, a price change) get buried inside “stage probability” instead of being modelled explicitly.
Core components and data foundation for reliable multi-touch forecasting
Multi-touch forecasting is only as good as the data underneath it. Before any model runs, you need a data foundation that treats every buyer interaction as a first-class, structured event rather than an afterthought buried in a CRM note field.
**1. A unified data layer.**Start with a CRM-normalised schema that maps every opportunity object to the same fields regardless of source system. Feed it from an event lake or customer data platform capturing web, product, and campaign activity, then connect that layer to your BI tool of choice, whether that’s Tableau or Power BI. The point is portability: your forecasting engine should survive a CRM migration or a merger without a rebuild.
2. Identity resolution at two levels. You need to resolve both the account (which company is this?) and the person (which stakeholder within that account is engaging?). Without account-level resolution, you’ll double-count a single enterprise deal as five separate leads. Without person-level resolution, you can’t tell whether the engaged party is the economic buyer or an intern downloading a whitepaper for a manager.

3. Disciplined event capture. Every logged event needs a minimum viable schema: timestamp, actor ID, event type, channel, and a link back to the opportunity record. Hygiene gates matter more than most teams admit. One of the most common and most damaging: an original_close_date field that never gets locked, so every slipped deal quietly rewrites forecasting history instead of flagging a slip event.
4. Integration priorities. Sequence your integrations by data reliability, not convenience. CRM object sync first, then marketing automation event streams, then product usage data if you sell SaaS, then paid media platforms last, since ad platform data tends to be noisiest and least tied to individual buyer identity.
An open-source, CRM-agnostic approach to this layer, normalizing CRM exports into a canonical opportunity schema, keeps the forecasting engine portable across whatever systems your GTM stack uses today or adopts tomorrow.
Pro Tip: Run a weekly data-quality check that flags any opportunity with more than one touchpoint gap longer than 14 days. Those gaps are usually where your forecast starts drifting from reality, and catching them early is far cheaper than diagnosing a bad quarterly number after the fact.
Getting this right is unglamorous work. It’s also the difference between a forecasting model that compounds in accuracy every quarter and one that needs a full retrain every time someone changes a field name. Auditing whether your CRM is actually ready for AI agents before you build on top of it saves months of rework later.
What behavioural signals actually predict pipeline movement?
The best predictive features come from behaviour, not opinion. Data teams building multi-touch forecasting models typically draw from four signal families, then engineer composite features on top of them.
Web behaviour tells you intent depth. Session length, repeat visits within a short window, and the sequence of pages visited (pricing page after a case study, for instance) carry far more predictive weight than a single page view. A prospect who visits your pricing page three times in a week behaves differently than one who visited it once and vanished.
Paid and organic campaign interactions matter most when weighted by recency. A prospect who clicked a retargeting ad yesterday is a different signal than one who clicked one four months ago, even if both technically “touched” the same campaign.
Product usage signals, for SaaS sellers running trials or freemium tiers, are often the single strongest predictor available. Feature adoption breadth, login frequency, and known churn indicators (a sudden drop in usage after weeks of activity) frequently outperform every marketing touchpoint combined.
Sales interactions round out the picture: meeting cadence, demo completion, and whether a rep has logged a documented next step rather than a vague “will follow up.” A logged next step with a date attached is a measurable behaviour. “Will follow up” is not.
From these raw signals, the highest-performing models build composite features rather than relying on raw counts:
- Momentum scores that track acceleration or deceleration in engagement over the last 30, 60, and 90 days.
- Recency-weighted touch counts that discount older interactions on a decay curve instead of treating a six-month-old click the same as yesterday’s.
- Sequence n-grams that capture the order of touchpoints, since “webinar then pricing page” predicts differently than “pricing page then webinar.”
Engineered features like these often outperform raw touch counts, because momentum and recency-weighted sequences capture direction and timing, not just volume. A deal with five touches accelerating over two weeks is a different animal than a deal with five touches spread evenly across two months, even though both show identical raw counts.
Which model approach fits your forecast?
No single model handles every forecasting situation well, and the teams that get burned are usually the ones that pick one method and force it onto every deal type. Match the model family to the data maturity and the deal pattern in front of you.
Weighted pipeline and forecast-category rollups remain the fastest, most defensible baseline. The math is simple: expected value equals deal value multiplied by a stage-specific probability, where that probability comes from your own historical close rates rather than an arbitrary guess. Benchmarked weighted-forecast calculations work well precisely because they’re transparent enough for a sales leader to audit by hand. Recalibrate the stage probabilities quarterly against actual outcomes, or the model quietly drifts.
Univariate time-series and regression models suit businesses with stable, repeatable demand patterns and enough historical volume to train on. If your revenue moves in predictable seasonal waves and your product mix doesn’t shift much, these models are cheap to run and easy to explain to a finance team.
Multivariate time-series and covariate-aware models earn their complexity when you have planned events that affect demand: a price change, a major campaign, a new market launch. Google’s TimesFM-3 research shows that foundation models handling known future covariates produce materially better forecasts when you can tell the model in advance that a promotion is coming, rather than asking it to infer that shift from history alone.
ML and LLM-enhanced approaches are the frontier, and they come with real trade-offs. Research on LLM-enhanced multivariate forecasting, including the M3Time approach presented at AAAI, shows improved robustness when blending language-model semantic priors with fine-grained temporal data. But zero-shot LLM forecasting techniques, like the token-multiplexing methods described in recent arXiv research, trade interpretability and compute cost for flexibility. If your finance team can’t explain why the model said what it said, you have a governance problem waiting to surface at the worst possible time.
Ensembles tie it together. Blending weighted pipeline, category rollups, and historical trend into one ensemble with explicit degradation rules gives you both accuracy and an honest confidence band, since ensembling with disagreement-based confidence bands narrows when methods agree and widens visibly when they don’t. That widening is a feature, not a flaw. It tells leadership exactly how much to trust this quarter’s number.
How do you build a multi-touch forecasting playbook?
Building this system in the right order matters more than building it fast. Skip a step and you’ll spend twice as long fixing it later.
- Define forecast objectives and accuracy targets. Decide upfront what “accurate” means for your business: within 10% of actuals at the category level? Within 5% at the deal level? Vague accuracy goals produce vague models.
- Map touchpoints and engineer features. Catalogue every trackable interaction across web, product, paid, and sales channels, then set explicit data-quality gates before any feature gets used in a model. A feature built on inconsistent data is worse than no feature at all.
- Select a modelling approach and a fallback strategy. Choose your primary method (weighted pipeline, regression, multivariate, or ensemble), and design the fallback for when a segment lacks enough history. Systems that automatically drop from complex ML to weighted pipeline or trend estimates in low-data conditions, and annotate the forecast with the fallback reason, keep leadership trust intact even when the sophisticated model can’t run yet.
- Backtest with holdout windows. Reserve at least two full sales cycles of historical data as a true holdout, never peeked at during training, and measure the model against actual closed outcomes before it touches a live forecast.
- Operationalise outputs and assign owners. Push forecast outputs into CRM fields and BI dashboards where reps and managers already work, assign a named owner for model health, and run a weekly cadence where forecast changes get reviewed against the underlying behavioural drivers, not just the number itself.
Pro Tip: Build the fallback logic before you build the sophisticated model, not after. Teams that design for graceful degradation from day one spend far less time firefighting when a new product line or acquired business unit shows up with three months of history instead of three years.
Getting sales operations aligned around this cadence, including how forecast data flows through your Salesforce CRM configuration, determines whether the playbook survives contact with a real sales floor.
What metrics prove your forecast is actually working?
A forecast nobody audits is just a guess with better formatting. Evaluation needs both statistical rigour and operational metrics that a sales leader can act on.
On the statistical side, track RMSE (root mean squared error) to penalize large misses, MAPE (mean absolute percentage error) for a business-readable accuracy figure, and quantile coverage if your model produces probabilistic forecasts, checking whether your 80% confidence interval actually contains the true outcome roughly 80% of the time.
On the operational side, four metrics matter most to a revenue leader:
| Metric | What it measures | Why it matters |
|---|---|---|
| Weighted forecast vs. actual | Gap between predicted and closed revenue per period | Direct measure of forecast reliability |
| Slip rate | Share of deals that move to a later close date | Flags pipeline health issues early |
| Coverage ratio | Pipeline value relative to target | Signals whether there’s enough pipeline to hit the number |
| Win rate by cohort | Close rate segmented by source, size, or stage | Reveals where the model’s assumptions break down |
Confidence bands should come from ensemble disagreement rather than a single model’s internal uncertainty estimate. When your weighted pipeline, regression, and ML models converge on a similar number, narrow the band and communicate high confidence. When they diverge, widen it and say so plainly.
Set a monitoring cadence, not a one-time check. Review model performance monthly, retrain when MAPE drifts more than a set threshold above your baseline, and sample a handful of forecasts for human review every cycle, since structured forecast review processes catch systemic errors that pure statistics miss.
Operational considerations: governance and integration
A technically sound model still fails if nobody owns it or trusts it. Governance is what turns a forecasting model into a forecasting process.
Assign clear roles: a forecast owner responsible for model health, functional managers who review category-level rollups weekly, and a defined escalation path when the model and the sales floor disagree by a wide margin. Ambiguity here is where good models quietly get abandoned.
Document every feature in a catalogue that explains, in plain language, what it measures and why it’s included. Explainability isn’t optional when finance and sales leadership are staking a quarterly plan on a number your model produced. If a stakeholder can’t get a straight answer to “why did the forecast move,” trust erodes fast, regardless of accuracy.
Automate hygiene gating rather than relying on manual review:
- Require specific fields (close date, deal owner, stage entry date) before an opportunity enters the forecasting pipeline.
- Run automated mapping tests whenever a new data source connects, checking that field types and value ranges match expectations.
- Flag and quarantine records with logic errors, like a close date in the past on an open deal, before they poison the training data.
Pro Tip: Route forecast outputs into the same CRM fields and BI dashboards your team already checks daily, not a separate reporting tool nobody opens. A brilliant forecast that lives in a spreadsheet nobody visits has zero operational value.
An AI analytics layer built for governance, rather than a black box, keeps this explainable as the model matures and stakeholders start asking harder questions about specific deals.
Brainiac Consulting: an open-source, integrated approach to multi-touch forecasting
Some consulting firms build AI agents and analytics systems specifically for marketing, sales, and finance workflows. This work can centre on AI operations platforms and products built to handle the agentic layer that sits on top of existing go-to-market stacks.
The identity resolution and graceful degradation problems covered above aren’t theoretical for us. They’re the daily reality of deploying forecasting systems inside organisations running Salesforce, HubSpot, Marketo, Power BI, and Tableau simultaneously, often with years of inconsistent data entry behind them. An open-source methodology matters here because it means no black-box model sits between your revenue team and the logic driving their forecast.
The organisations that get the most value from multi-touch forecasting aren’t the ones with the fanciest model. They’re the ones who fixed their data hygiene first, built explainability into every feature, and designed for the day their history runs thin, not just the day it’s plentiful.
Engagements typically start with an assessment of what’s already in place, since building a multivariate ensemble on top of ungoverned CRM data just produces a more confident version of a bad number. Readers should expect a consultancy engagement to surface real gaps before proposing a fix. Not every organisation is ready for the full playbook on day one, and a credible partner says so.
Turning a forecast into a decision
A forecast is only useful once someone acts on it differently than they would have otherwise. Sales leaders should treat the weighted forecast number as a planning input for capacity and hiring, not a scoreboard for individual reps. When the confidence band widens on a specific segment, that’s a signal to dig into the behavioural drivers behind it, not to ignore the number until it’s too late to react.
Marketing teams get the most value from multi-touch outputs when they use the attribution weighting to reallocate budget toward the channels and content actually correlated with movement, not just the channel that happened to get last-click credit. If a webinar series consistently shows up early in winning sequences, that’s worth more budget even if it never shows up as the final touch before a form fill.
Finance and RevOps should treat slip rate and coverage ratio as early-warning indicators, reviewed on the same weekly cadence as the headline number, not quarterly. A rising slip rate three weeks before quarter-end is actionable. The same signal discovered after the quarter closes is just a post-mortem.
The operational habit that separates teams who benefit from this system from teams who don’t: review the forecast alongside the behavioural drivers behind it in the same meeting. A number without its underlying signal invites people to argue about the number. A number with its signal invites people to fix the pipeline.
What tools support multi-touch forecasting deployments?
Most multi-touch forecasting deployments run on a combination of three layers rather than a single piece of software. CRM platforms like Salesforce and HubSpot hold the opportunity data and increasingly ship native forecasting features, including AI-assisted forecasting modules that analyse pipeline signals directly inside the CRM.
Marketing automation platforms like Marketo supply the campaign-touch event stream, while structured email and campaign workflows generate much of the behavioural data that feeds attribution weighting in the first place. BI platforms, particularly Tableau and Power BI, sit on top to visualise weighted forecasts, confidence bands, and cohort win rates for stakeholders who never touch the raw model.
The connective layer, often the hardest part to get right, is where open-source and CRM-agnostic forecasting engines earn their place. A normalised schema that ingests from any CRM and outputs a consistent set of forecasting features avoids locking your entire revenue process into whichever platform you happened to standardise on five years ago. Marketing operations platforms and broader martech consulting support typically stitch these layers together in practice, since few organisations run a single clean stack from day one.
Whatever combination you choose, prioritise integrations that push forecast outputs back into the tools your team already opens daily. A forecasting model that requires a separate login is a forecasting model that eventually gets ignored.
How do you keep a forecasting model accurate over time?
Multi-touch forecasting models degrade if left alone, quietly and predictably. Buyer behaviour shifts, product lines change, and a model trained on last year’s patterns starts drifting the moment this year’s buyers behave differently.
Retrain on a fixed schedule rather than waiting for a visible failure. Monthly retraining works for most mid-market and enterprise deployments, though fast-moving product categories may need it more often. Track MAPE and RMSE trend lines over time, not just single-period snapshots, since a model can look fine for two months and then drift sharply in the third.
Revisit the feature catalogue quarterly. New touchpoints emerge (a new product feature, a new ad channel) and old ones lose relevance as buyer habits change. A feature that predicted well eighteen months ago can become noise without anyone noticing until accuracy quietly slips.
Keep a human-review sample in every cycle. Even a well-monitored model benefits from someone checking a handful of specific forecasts against what actually happened, because statistical metrics can mask a systemic bias that only becomes obvious deal by deal.
Finally, treat governance documentation as a living artifact, not a one-time deliverable. Update the feature catalogue, the fallback rules, and the ownership assignments every time the underlying data sources or team structure change. Models that get maintained like software, with version control and change logs, stay trustworthy years longer than ones treated as a one-off project.
A practitioner’s view on timelines and pitfalls
Multi-touch forecasting rarely delivers overnight results, and teams that expect it to usually abandon the project during the messy middle phase. A realistic pilot runs 60 to 90 days: enough time to validate data quality, get identity resolution working, and produce a first weighted forecast worth comparing against the old process. Validation, running the new model alongside the old one before fully switching over, typically takes another quarter. Full scale, where the model becomes the primary forecasting input across segments, is usually a two-quarter effort at minimum.
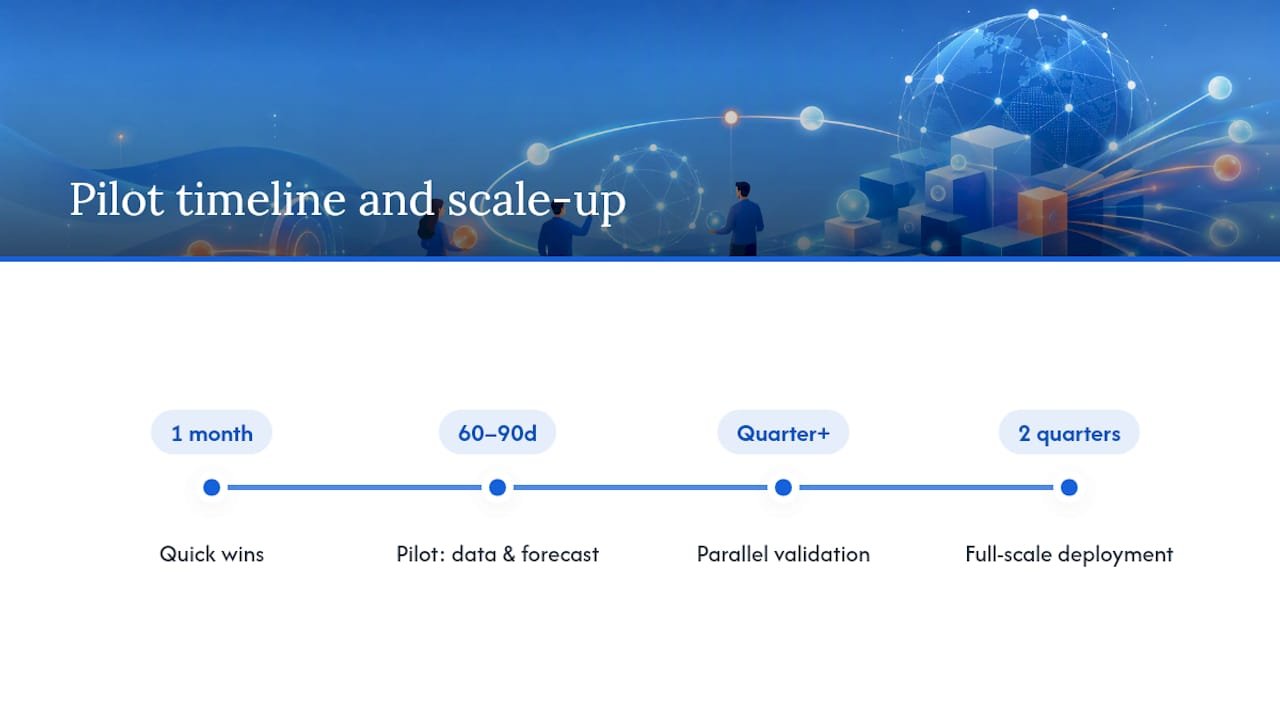
Quick wins show up early, and they matter for keeping stakeholder patience intact. An improved weighted forecast calibrated on real stage probabilities, or a lead-prioritisation list built from momentum scores, can prove value inside the first month, well before the full model is production-ready.
The pitfalls are predictable: weak identity resolution that double-counts accounts, models overfit to a narrow historical window that breaks the moment market conditions shift, missing governance that lets a model quietly drift unchecked, and leadership decks that report a single point forecast while ignoring the confidence band entirely. Every one of these is preventable. None of them announce themselves until the quarter you can least afford the surprise.
— Don
How Brainiac Consulting can help you build this
If you’re staring at a forecast that’s wrong more often than it’s right, the fix usually isn’t a better spreadsheet. It’s the underlying data foundation and model architecture covered above, built once and maintained properly. Consulting firms design AI-Enabled Analytics for the forecasting layer itself, Custom Agent Deployment for automated data hygiene and event capture, and Martech Implementations to integrate Salesforce, HubSpot, Marketo, and BI tools into a coherent forecasting pipeline.
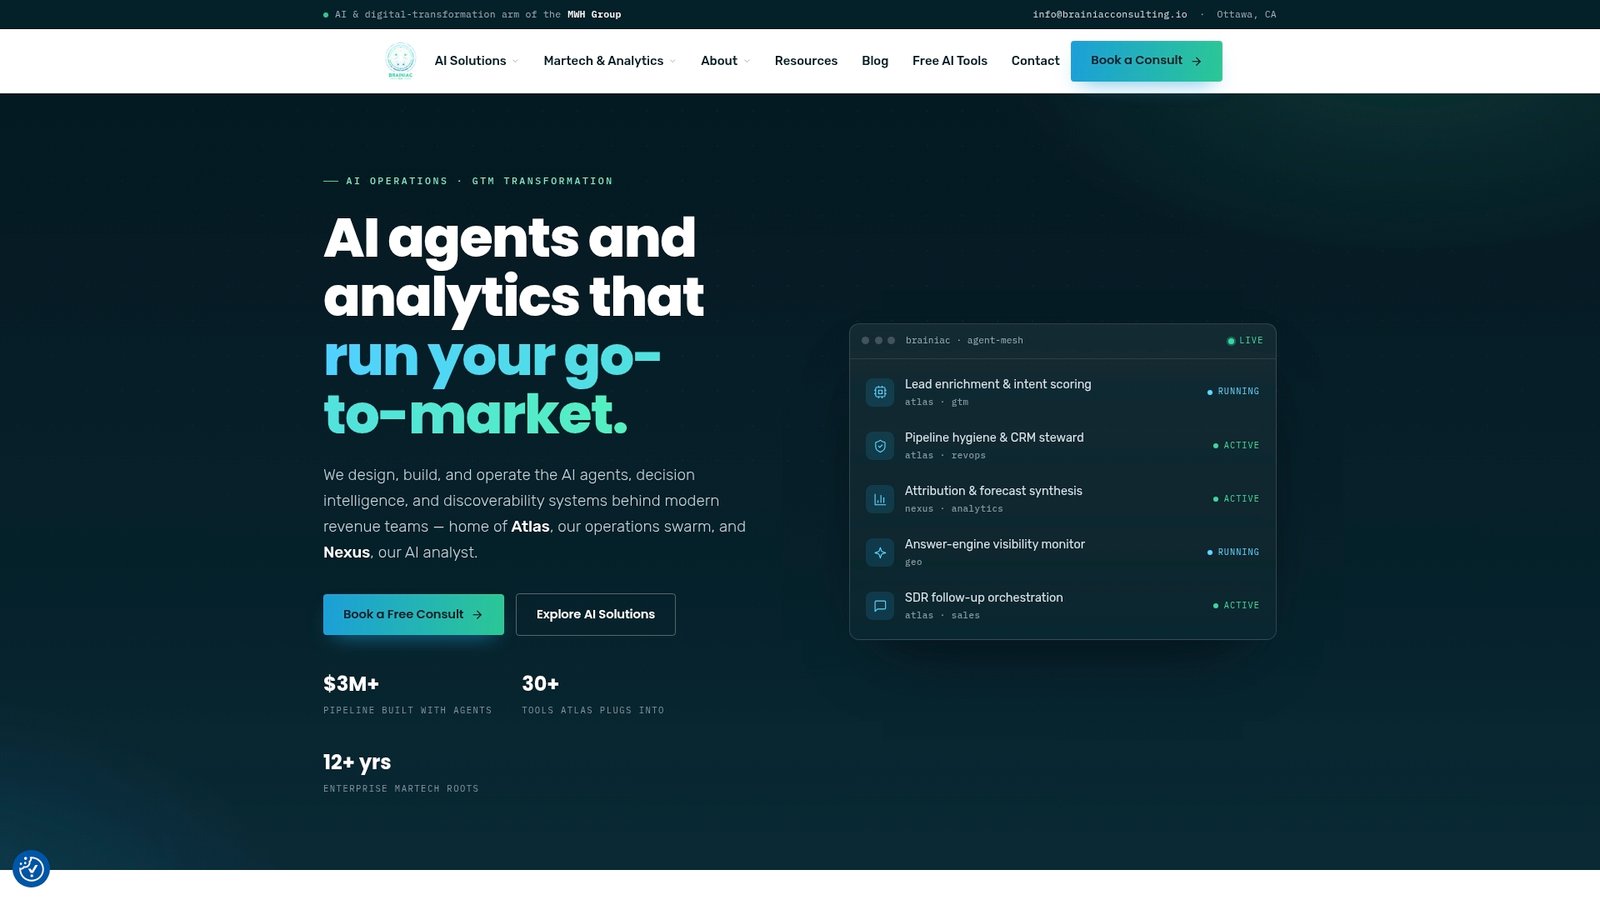
Open-source methodology is sometimes used to avoid black-box solutions, which is important in forecasting, where finance and sales leadership need to trust exactly why a number moved. If your team is ready to see where your current pipeline data actually stands, start with an AI readiness assessment to map the gaps before committing to a full build. From there, explore Brainiac Consulting’s full range of services to find the right entry point for your organisation’s stage.
Sources
- Choosing the right forecasting model: types and examples | Salesforce
- milesc-bot/revops-forecast — CRM-agnostic revenue forecasting (GitHub)
FAQ
What are the four types of forecasting?
Most sales organisations use some combination of pipeline (or weighted) forecasting, forecast-category rollups, historical trend analysis, and intuition-based rep forecasts. Multi-touch forecasting sits on top of these by adding behavioural signals as predictive features, rather than replacing any single method outright, which is why ensembling multiple methods tends to outperform relying on just one.
What does “multi-touch” mean in forecasting?
“Multi-touch” means every tracked buyer interaction, web visits, ad clicks, product usage, sales meetings, contributes weighted credit toward predicting an outcome, instead of crediting only the first or last touchpoint. This mirrors multi-touch attribution in marketing measurement, applied specifically to predicting whether and when a deal will close.
What is multivariate forecasting and how does it work?
Multivariate forecasting predicts an outcome using several related variables at once, rather than relying on a single historical time series. Models like TimesFM-3 use known future covariates such as planned promotions to materially improve accuracy over models that only see past data.
What are the five forecasting methods commonly used in sales?
The five most common approaches are weighted pipeline forecasting, forecast-category rollups, historical trend or time-series analysis, regression-based models, and increasingly, machine learning or AI-enhanced multi-touch models. Each fits different data maturity levels, with simpler methods serving as reliable fallbacks when historical data is too thin for the more advanced approaches.
Does Brainiac Consulting build multi-touch forecasting systems?
Yes. Brainiac Consulting designs and deploys AI-Enabled Analytics and Custom Agent Deployment engagements that build the data foundation, feature engineering, and model architecture multi-touch forecasting requires, integrated directly with platforms like Salesforce, HubSpot, and Tableau. Current pricing for these engagements is available directly on the Brainiac Consulting site.