

Start simple, validate with experiments, then graduate to data-driven models once you can measure cause and effect, not just correlation. For most ecommerce teams, that means a basic multi-touch model like linear or U-shaped first, clean tracking and a single source of truth always, and incrementality testing before anything algorithmic. The model’s name matters far less than whether your tagging, tracking, and governance are trustworthy.
TL;DR:
- Data volume limits the effectiveness of data-driven attribution models; until you have enough conversions, rely on simpler rule-based models like linear or U-shaped.
- Consistent tagging and event tracking, especially with agreed-upon UTM naming conventions, are essential to ensure accurate and trustworthy attribution data.
- Incrementality testing using holdout, geo, or full randomized controlled trials is necessary to validate whether attribution models reflect true causal effects.
- Platform reporting often differs from store data due to counting methods and view-through conversions; select one source as your definitive number for financial reporting.
- Starting with basic models and validated data hygiene reduces the risk of overfitting and misattribution, enabling more reliable decision-making as your data volume grows.
Table of Contents
- What the common attribution models are and how each assigns credit
- How do you choose the right attribution model for your business?
- How to instrument attribution so model outputs are trustworthy
- Using experiments and calibration to make attribution causal
- What commonly trips teams up when they rely on attribution
- A practitioner’s roadmap for getting attribution right
- How Brainiac Consulting helps teams get attribution right
- Sources
- FAQ
What the common attribution models are and how each assigns credit
Attribution models exist to answer one question: which touchpoints deserve credit for a sale? Each model answers it differently, and the differences matter when you are deciding where to put next quarter’s budget.
Single-touch models are the simplest and the most limited. First-click attribution gives all the credit to the first interaction, which flatters awareness channels like organic search or display but ignores everything that closed the sale. Last-click attribution does the opposite: it rewards the final nudge, usually paid search or a retargeting ad, and undervalues the channels that built the demand in the first place. Both are easy to set up and easy to misread.
Multi-touch, rule-based models spread credit across the customer’s path:
- Linear attribution splits credit evenly across every touchpoint, which is fair but treats all interactions the same regardless of their nature.
- Time decay weights recent touches more heavily, useful when the sales cycle is short and the last few interactions genuinely matter more.
- Position-based (U-shaped) attribution gives the first and last touch most of the credit, with the remainder split among the middle touches, suiting teams that care about both awareness and conversion.
- W-shaped attribution adds a third key touchpoint, often the lead qualification, splitting credit across three important stages, suitable for longer or more complex purchase journeys.
Data-driven, algorithmic attribution is different in kind, not just in formula. Rather than applying a fixed rule, it uses machine learning to weight touchpoints based on patterns in your own conversion data. Google Analytics and Google Ads offer data-driven attribution and recommend it specifically when you have enough conversion and interaction volume to train the model reliably; switching to it changes both reported conversions and how automated bidding optimises. Without that volume, the model is fitting noise, not patterns.
Custom weighting models let you encode business logic directly (perhaps your own research shows email deserves a 1.5x multiplier for repeat customers) but they require the same data discipline as algorithmic models, plus ongoing maintenance as your channel mix shifts.
As a rule of thumb: use first or last click only for quick diagnostics, never for budget decisions. Use linear when you genuinely don’t know which touchpoints matter. Use position-based or time decay when you have a working hypothesis about which moments count most. Reserve data-driven attribution for when your volume supports it and you have already validated the result against reality.
How do you choose the right attribution model for your business?
The right model depends on three things: what you are trying to optimise, how long your customers take to buy, and how much data you generate. Get these three right and the model choice becomes almost mechanical.
If your goal is new customer acquisition, weight toward models that credit upper-funnel discovery, like position-based or a custom first-touch-weighted scheme. If your goal is efficient ROAS on existing demand, time decay or last-touch-leaning models will align better with what your paid search and retargeting teams actually influence. A short sales cycle (same-day impulse purchases) tolerates simpler models. A longer cycle with research, cart abandonment, and remarketing benefits from W-shaped or data-driven approaches that capture the full path.
Data volume is the gatekeeper for complexity. Google’s own guidance ties data-driven attribution to having sufficient conversion and interaction volume to train against; below that threshold, the model has too little signal to learn from and will produce unstable, hard-to-trust weights. If your store converts only a handful of times a day, stick with a rule-based model and revisit algorithmic options as volume grows.
Whatever model you choose for marketing optimisation, keep a separate, consistent source of truth for finance and ROAS reporting. Platform-reported conversions and your store’s own order data will disagree, often because of differences in counting methodology rather than any real discrepancy in sales, as Shopify’s own documentation on attribution notes. Pick one system (usually your store’s order data) as the number that goes in board decks, and treat platform metrics as tactical signals for channel optimisation.
A practical sequence to get there:
- Audit your tagging and event tracking for gaps and inconsistencies before touching any model.
- Pick a simple starter model (linear or U-shaped) that matches your funnel shape.
- Schedule your first incrementality test on your largest-spend channel within the next quarter.
- Define in advance the data volume and test results that would justify migrating to a data-driven model.
Pro Tip: Write your migration criteria down before you start testing, so a good result doesn’t get argued away later by whichever channel owner stands to lose budget.
How to instrument attribution so model outputs are trustworthy
No attribution model, however well-chosen, survives messy inputs. The engineering underneath the model determines whether its output means anything.
Start with UTM discipline. Inconsistent campaign naming (utm_source=FB one week, Facebook the next) silently fractures a channel’s reported performance across multiple rows in your reports, understating its true contribution. Agree on a naming convention, document it, and enforce it before launching new campaigns, not after discovering the mess in a quarterly review.
Next comes the pixel versus server-side tracking decision. Browser-based pixels are easy to deploy but increasingly blocked or limited by browser privacy settings and ad blockers, which quietly erodes the signal you’re trying to measure. Server-side tracking, where your own servers send event data directly to ad platforms and analytics tools, is more resilient to that signal loss, though it takes more engineering effort to set up and maintain. Shopify’s reporting documentation lists the common models available in its reports, including last non-direct click and any-click attribution, and notes that differing report settings often explain discrepancies between tools rather than any real change in customer behaviour.
Attribution windows and lookback settings change your numbers even when nothing about customer behaviour has changed. A 7-day click window will report fewer conversions for a channel than a 30-day window, simply because it counts fewer of the touches that preceded the sale. Keep windows consistent across platforms wherever the platform allows it, and document any mismatch you can’t fix.
A short integration checklist keeps the pieces aligned:
- Confirm your CDP, CRM, analytics platform, and ad platforms all receive the same event definitions for “purchase,” “add to cart,” and similar key actions.
- Reconcile order counts between your store and each ad platform weekly, not just when something looks wrong.
- Flag any channel whose reported conversions drift more than a reasonable margin from your source of truth for investigation.
One of the clearest warnings here comes from recent research on model complexity: attribution models built without sufficient data or causal validation risk producing misleading, black-box outputs that look sophisticated but don’t hold up under scrutiny. Fixing tagging and event hygiene first is cheaper insurance than any algorithm.
Using experiments and calibration to make attribution causal
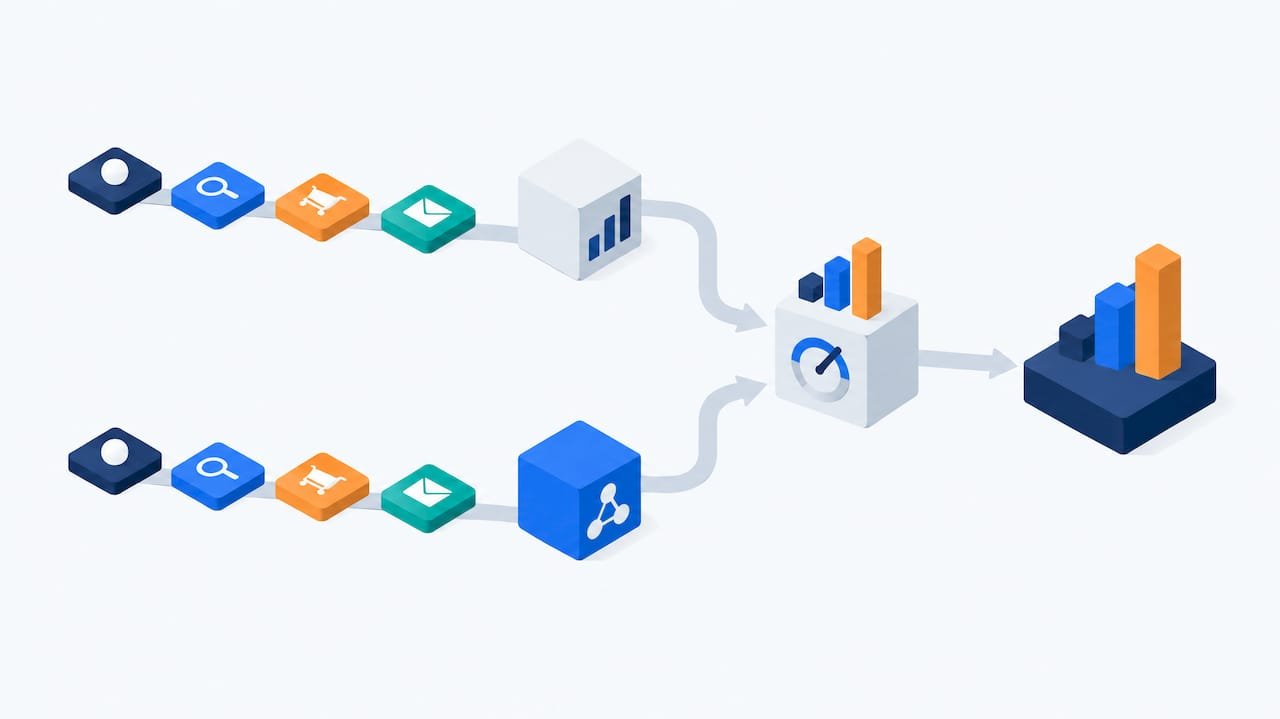
Here is the uncomfortable truth about almost every attribution model discussed so far: they are observational, which means they describe correlation, not proven cause. A customer who clicked a retargeting ad before buying might have bought anyway. Attribution models can’t tell you that on their own.
Incrementality testing closes that gap. An audience holdout test removes a channel’s exposure for a portion of customers and compares their conversion rate to the rest; a geo test turns a channel off in some regions while keeping it on in others; a full randomized controlled trial (RCT) randomly assigns exposure and measures the difference directly. All three answer the question attribution models can’t: what happens if this channel disappears?
- Holdout and geo tests are cheaper and faster but introduce more noise and confounding.
- Full RCTs give the cleanest causal read but require enough scale and patience to detect a real effect.
- Neither replaces the other; many teams run geo tests routinely and reserve full RCTs for their highest-spend channels.
This is where Predicted Incrementality by Experimentation (PIE) becomes genuinely useful for ecommerce teams who can’t run an RCT on every campaign. PIE uses a sample of RCTs to learn a mapping between campaign features and their true causal effects, then applies that mapping to calibrate the far larger set of campaigns that were never tested directly. In the research behind the approach, this method achieved substantially better out-of-sample predictive accuracy than last-click attribution, a gap wide enough to change real budget decisions. Amazon’s own multi-touch attribution work follows a similar logic, combining RCTs with machine learning to translate experiment results into touchpoint-level credit across the broader campaign set.
Attribution tells you who was in the room when the sale happened. Incrementality testing tells you who actually made the difference.
Run your first RCT or geo test on the channel that consumes the largest share of your budget, since that’s where a calibration error costs the most. Plan for enough volume to detect a meaningful lift before you start, not after the test underwhelms.
What commonly trips teams up when they rely on attribution
The most common mistake is adding complexity before adding validation: a sophisticated model with no incrementality check behind it is a confident-sounding guess, and the overfitting risk is well documented in attribution research. Complexity should follow evidence, not precede it.
A second trap is assuming platform dashboards and your store’s own numbers should match. They often won’t, because ad platforms and your storefront count differently, sometimes including view-through credit the store never sees.
- Expect reconciliation gaps between platform-reported and store-reported conversions; investigate large ones, don’t chase small ones.
- Privacy-driven signal loss tends to bias attribution toward easy-to-track channels like branded search, making them look stronger than they are.
- Switching models mid-quarter will reshuffle fractional credit across channels even if nothing about customer behaviour changed, so compare like for like.
Pro Tip: Before presenting a model change to stakeholders, run last month’s numbers through both the old and new model so everyone sees the shift is methodological, not a sign that a channel suddenly stopped working.
A practitioner’s roadmap for getting attribution right
Our view, built from working through these decisions with marketing and analytics teams, is that the sequence matters more than the sophistication. Fix data hygiene first, adopt a simple rule-based model second, run targeted incrementality tests third, and only then move to a calibrated, data-driven model once you have both the volume and the experiment evidence to trust it.
Keeping measurement in-house works well while your stack is simple and your team has the bandwidth to maintain tagging discipline. Bringing in outside expertise tends to pay off once you’re juggling multiple platforms, need formal experiment design, or want attribution integrated across Salesforce, HubSpot, and your analytics stack without months of trial and error. We’ve seen teams skip straight to algorithmic attribution and then spend a quarter unwinding bad decisions it had already caused.
— Don
How Brainiac Consulting helps teams get attribution right
Getting from “we guess our mix is working” to “we can prove which campaigns drive incremental revenue” is exactly the gap our revenue attribution services are built to close. We design the tagging, the experiment plan, and the calibrated model together, rather than handing you a dashboard and leaving the hard part to you.
Our work typically includes auditing and rebuilding UTM and event tracking to improve data reliability, designing incrementality tests and calibration so your model better reflects causal effects, and integrating attribution outputs with popular analytics platforms to help finance and marketing align on numbers.
If your team is weighing a move to data-driven attribution but isn’t sure your data or governance can support it, our AI-enabled analytics work covers that readiness question directly. Reach out for an assessment of where your measurement stack stands today.
Sources
- On the risks of overfitting complex attribution models (arXiv)
- Change the reporting attribution model for key events – Analytics Help
FAQ
What are the four main types of attribution models?
The four commonly discussed types are single-touch (first-click or last-click), multi-touch rule-based (linear, time decay, position-based), data-driven or algorithmic, and custom-weighted models. Each assigns credit differently, so the right choice depends on your sales cycle, data volume, and what decision the model needs to support.
What are some effective tools for ecommerce attribution?
Google Analytics and Google Ads both offer built-in data-driven attribution once you have enough conversion volume, while Shopify’s own reporting covers simpler models like last non-direct click and linear attribution. Beyond platform-native tools, incrementality testing platforms and managed analytics services, such as the work covered under revenue attribution, help teams calibrate those models against real causal results.
What are the four types of ecommerce business models?
This question refers to business models, not attribution models, so it’s a different topic: common ecommerce business types include business-to-consumer (B2C), business-to-business (B2B), consumer-to-consumer (C2C), and direct-to-consumer (D2C). None of these affect which attribution model fits your marketing measurement, which depends on sales cycle and data volume instead.
How do I know when my store has enough data for algorithmic attribution?
There’s no single fixed threshold, but Google recommends data-driven attribution specifically when you have sufficient conversion and interaction volume to train the model reliably. If your conversions are still infrequent, a rule-based model like linear or position-based will give more stable, interpretable results in the meantime.
Why do my ad platform and store conversion numbers never match?
They’re counting differently: ad platforms often include modelled or view-through conversions that your store’s checkout data never records, which is why Shopify documents frequent discrepancies between platform and store reporting. Pick one system as your source of truth for finance and treat the others as directional signals for campaign optimisation.