

Prioritize three numbers before anything else: pipeline coverage ratio, stage-to-stage conversion, and time-in-stage. Pull those for your current forecast window today. Everything else in your CRM is context; these three tell you whether you’ll hit the number and where the deal flow is breaking down.
TL;DR:
- Maintaining a pipeline coverage ratio of around 3x is crucial, but it must be adjusted based on historical win rates and seasonal market conditions.
- Analyzing stage-to-stage conversion and identifying the largest dropout points directly reveal where prospects stall and where to focus improvement efforts.
- Incorporating outlier analysis of time-in-stage and engagement data helps detect stalled deals and underlying issues before deals are lost.
- Automating data hygiene, enrichment, and engagement scoring with AI platforms improves forecast accuracy and reduces manual CRM upkeep.
- Regularly reviewing pipeline metrics weekly, monthly, and quarterly ensures that process changes are effective and forecast vulnerabilities are addressed promptly.
Table of Contents
- What is sales pipeline analytics, really?
- How do you conduct a sales pipeline analysis?
- What should a sales pipeline analytics dashboard include?
- Which segmentation and cohort techniques reveal hidden problems?
- What pipeline data problems quietly wreck your forecast?
- Brainiac case evidence: how AI and governed analytics improve pipeline outcomes
- Actionable playbook: what to run this week, month, and quarter
- How do market trends and seasonality affect pipeline metrics?
- How does pipeline analytics fit into your overall sales strategy?
- What are the best practices for aligning sales and marketing around pipeline data?
- Future-proofing pipeline analytics
- Turn this playbook into a running system
- Sources
- FAQ
What is sales pipeline analytics, really?
Sales pipeline analytics is the discipline of measuring how deals move through your funnel, converting raw CRM activity into forecasts you can defend to your board. It’s distinct from pipeline management, which is the day-to-day updating of deal stages and next steps. Analysis looks backward and forward at once: it explains why a cohort underperformed last quarter and predicts whether this quarter’s pipeline will actually close.
Here are the metrics that carry the most forecasting weight, along with how to calculate each one:
-
Coverage ratio = total qualified pipeline value ÷ revenue target. A team with a $2 million quota and $6 million in qualified pipeline is running at 3x coverage, a common benchmark for a quarter with a historical 30 to 35% win rate.
-
Stage-to-stage conversion = deals advancing out of a stage ÷ deals that entered it. This isolates exactly where prospects stall, rather than blending the whole funnel into one misleading average.
-
Time-in-stage (velocity) = average (or better, median) number of days a deal sits in a given stage before moving forward or dying.
-
Number of qualified opportunities, average deal size, win rate, and sales cycle length — the four foundational figures that, together, let you reverse-engineer how much new pipeline you need every month.
-
Leading indicators: new opportunities created, lead response time, and engagement depth (multi-threading across buying-committee contacts) — these move before revenue does, which makes them your early warning system.
Pro Tip: Don’t just average time-in-stage. Look at the p95 outliers too — those are the deals quietly rotting at the bottom of your forecast.
Industry guidance backs the core metric set: pipeline coverage, stage conversion, time-in-stage, deal size, and win rate form the foundation most sales organizations track, and that foundation hasn’t changed much even as the tooling around it has gotten smarter.
How do you conduct a sales pipeline analysis?
A pipeline review that actually changes outcomes follows a specific order. Skip a step and you’ll fix the wrong problem.
- Set the target and forecast window. Define the revenue goal and the exact period (30, 60, or 90 days) you’re analyzing against.
- Validate coverage. Compare qualified pipeline value to target. Below 3x, you likely have a generation problem, not a conversion problem.
- Audit conversion between every stage. Find the single largest drop-off point. That’s your leverage point, not the stage everyone assumes is broken.
- Flag stalled deals. Sort by time-in-stage outliers and cross-check against engagement data (last email reply, last meeting held). Silence plus stalling is the strongest churn signal in a pipeline.
- Segment for root cause. Break results out by rep, lead source, deal size, and entry cohort to see whether the problem is systemic or localized.
- Prioritize interventions. Pick the one or two fixes with the biggest projected impact and define what success looks like in numbers, not vibes.
This sequencing, moving from target to coverage to conversion audit to segmentation, mirrors the practical pipeline-review workflow that experienced revenue operations teams use, and it works because each step narrows the search space before you commit resources to a fix.
What should a sales pipeline analytics dashboard include?
Build your dashboard around five panel types, and centralize the data feeding them before you worry about visual polish.
- Waterfall view showing how pipeline value changed week over week (new, won, lost, pushed).
- Funnel conversion panel with stage-to-stage percentages side by side.
- Time-in-stage histograms, not single averages, so you can see the outlier tail.
- Cohort panels comparing deals by entry month or source.
- Deal-health signals, blending stage timestamps with engagement data to flag risk before a deal is officially “stuck.”
Centralize your CRM, marketing automation platform, meeting and email engagement tools, and BI exports into one source of truth. A Salesforce-based pipeline template gives you a working waterfall and funnel layout out of the box, and teams centralizing CRM and automation data typically cut the manual reconciliation work that eats a rep’s Friday afternoon.
| Panel | Executive view | Rep-facing view |
|---|---|---|
| Waterfall | Quarterly net change | Weekly personal pipeline change |
| Funnel conversion | Company-wide by stage | Individual stage conversion |
| Time-in-stage | Aggregate histogram | Flagged personal stalls |
| Deal health | Portfolio risk score | Per-deal risk flags |
AI-driven scoring increasingly replaces the manual scan through stalled deals, surfacing at-risk opportunities and recommended next actions automatically rather than waiting for a human to notice a gap in activity. This shift toward real-time, action-oriented pipeline intelligence is what separates a static weekly report from a system that actually changes seller behaviour before a deal dies.
Which segmentation and cohort techniques reveal hidden problems?
Aggregate numbers hide almost everything useful. A 28% average win rate might conceal one rep at 45% and three at 20%, and averages alone will never tell you that.
- Cohort by entry month to separate seasonal effects from genuine process problems.
- Cohort by source (inbound, outbound, partner, referral) to see which channel produces pipeline that actually closes, not just pipeline that looks good on a slide.
- Compare rep-to-rep and channel-to-channel conversion rates to isolate process variance from market variance.
- Combine engagement signals, email cadence, meeting frequency, multi-threading, with stage timestamps to build a genuine deal-health score rather than relying on stage alone.
Segmenting by entry cohort and tracking time-in-stage percentiles over time is the most reliable way to confirm whether a process change (a new qualification script, a revised discovery template) actually moved the needle, or whether one lucky cohort skewed the whole read.
What pipeline data problems quietly wreck your forecast?
Most forecasting misses trace back to four repeatable mistakes, and each one has a fast fix.
- Inconsistent stage definitions. Standardize entry and exit criteria for every stage in writing, and audit reps against it quarterly.
- Stale CRM data. Require re-validation of close dates and next steps every two weeks, or automate enrichment so it doesn’t depend on rep memory.
- Chasing vanity metrics. Total pipeline value looks impressive; conversion rate and velocity tell you if it’s real.
- Ignoring stalled-deal signals until they’re already dead.
Pro Tip: Three fast unsticks: reassign the next action to a specific date, add a second contact at the account, and ask the rep directly whether the deal is still real. Half the time it isn’t, and that’s useful information too.
Brainiac case evidence: how AI and governed analytics improve pipeline outcomes
Automating the boring parts of pipeline hygiene, enrichment, stage validation, engagement tracking, frees analysts to focus on the judgment calls that actually move revenue. Brainiacconsulting builds this on open-source integrations and a governed AI Analyst layer that sits on top of existing CRM data rather than replacing it, which matters because rip-and-replace projects rarely survive contact with a live sales team.
- Client engagements have driven measurable improvement in lead-to-opportunity conversion by closing the gap between marketing hand-off and sales qualification.
- Combined Marketo and Salesforce deployments have supported multimillion-dollar pipeline creation through cleaner attribution and faster routing.
- The practical takeaway for most teams: automate data hygiene and engagement scoring first, then layer predictive signals on top, in that order, not the reverse.
Full detail on methodology and results sits in the case study library if you want to see how the sequencing plays out across different sales motions.
Actionable playbook: what to run this week, month, and quarter
Analytics only pays off with a fixed operating rhythm. Here’s the cadence that keeps insight from turning into another dashboard nobody opens.
- Weekly (tactical): Pull coverage and conversion numbers, build a top-10 stalled-deal list with named owners and next actions.
- Monthly (analytical): Run cohort conversion analysis and test two process changes (a new discovery script, a revised qualification checklist) against a control group.
- Quarterly (strategic): Review stage definitions, reassess rep capacity, and reset the coverage target based on the last quarter’s actual win rate.
| Cadence | Primary task | Success criterion |
|---|---|---|
| Weekly | Stall list with owners | Every flagged deal has a next action within 48 hours |
| Monthly | Cohort test | Test cohort shows measurable lift versus control |
| Quarterly | Stage and capacity review | Coverage target reflects trailing-quarter win rate |
This tiered structure, weekly tactical, monthly trend, quarterly structural, is standard across teams that treat pipeline review as a discipline rather than a once-a-quarter fire drill.
How do market trends and seasonality affect pipeline metrics?
Coverage ratios and conversion rates aren’t static numbers; they shift with the calendar and the economy around you. A B2B software team selling into retail will see pipeline generation slow every fourth quarter as buyers freeze budgets for the holidays, then spike in January when new fiscal-year budgets unlock. If you benchmark October’s conversion rate against January’s without adjusting for that pattern, you’ll draw the wrong conclusion about whether your team is improving or declining.
Broader market conditions compound this. A slower economy typically stretches sales cycles and lowers win rates as buyers add approval layers and delay decisions, even when your product and messaging haven’t changed at all. If you don’t segment your historical data by season and macro period, a genuinely weak quarter can look identical to a strong quarter that simply landed at a seasonally tough time.
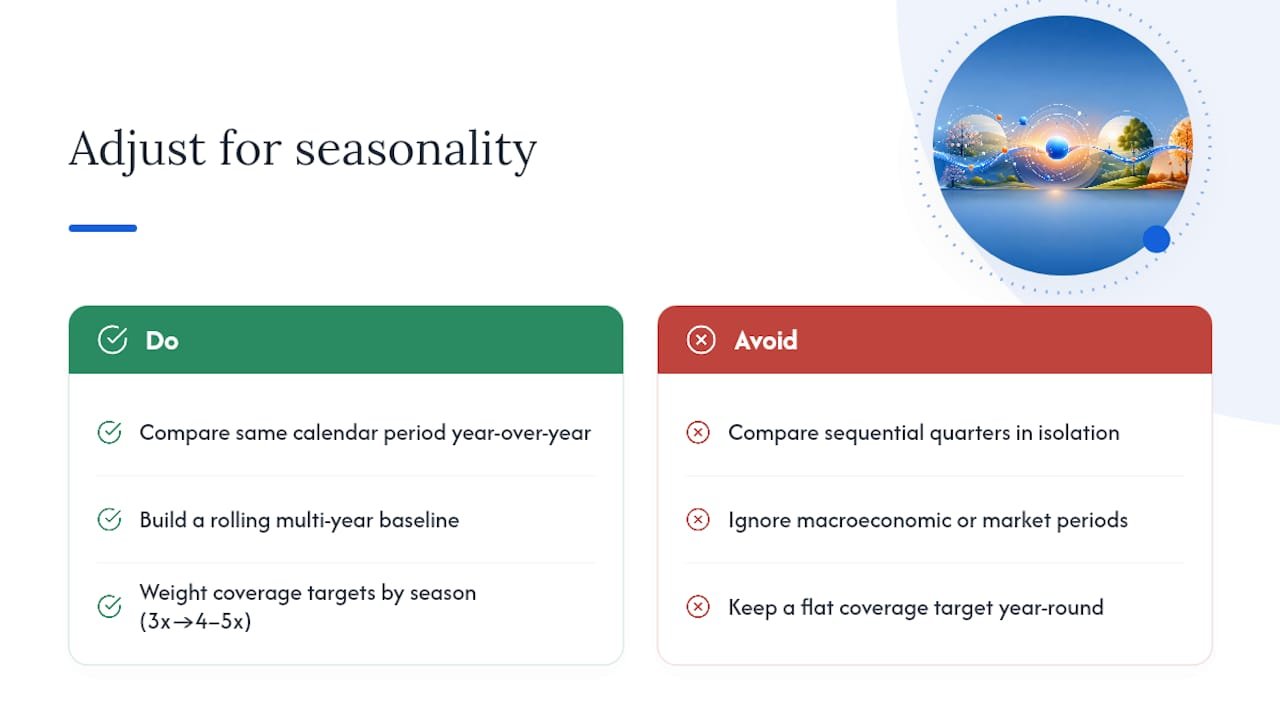
The fix is building a rolling, multi-year baseline rather than comparing quarter to quarter in isolation. Track coverage ratio and conversion by the same calendar period year over year, not just sequentially, so a seasonal dip doesn’t trigger a false alarm and a seasonal spike doesn’t create false confidence. When you do spot a real deviation from the seasonal norm, that’s the signal worth acting on: a genuine process problem or a genuine market shift, not the calendar doing what it always does.
This also means your coverage targets shouldn’t be flat across the year. A target set at 3x during a peak-demand quarter might need to rise to 4x or 5x heading into a historically slow one, simply because win rates compress when buying committees stall. Rebuilding your coverage model with seasonal weighting, rather than a single static multiplier, keeps your forecast honest through the parts of the year that naturally work against you.
How does pipeline analytics fit into your overall sales strategy?
Pipeline analytics only earns its keep when it’s tied directly to the revenue goals your leadership team is already accountable for, not treated as a side project for the analytics-minded. If your quarterly target requires $10 million in closed revenue and your historical win rate sits at 25%, that math tells you exactly how much qualified pipeline needs to exist by a specific date. Everything downstream, hiring plans, marketing spend, territory design, should trace back to that number.
This means pipeline metrics need to inform decisions well outside the sales team’s four walls. If conversion from a specific lead source is consistently weak, that’s not just a sales problem to flag in a weekly meeting; it’s a signal that should reshape where marketing spends its budget next quarter. If a particular rep segment closes larger deals but takes longer to do it, that’s a capacity-planning input for whoever builds next year’s headcount model.
The strategic layer also means setting coverage and conversion targets that ladder up from company goals rather than being invented locally by each team. A sales manager setting an arbitrary “3x coverage” rule without checking it against the actual historical win rate for their specific segment is guessing, not planning. Pull the real historical conversion data for that segment, calculate the coverage ratio the math actually requires, and set the target from there.
Done well, pipeline analytics becomes the shared language between sales, finance, and executive leadership: one dataset everyone trusts instead of three competing spreadsheets built by three different departments with three different definitions of a “qualified” deal.
What are the best practices for aligning sales and marketing around pipeline data?
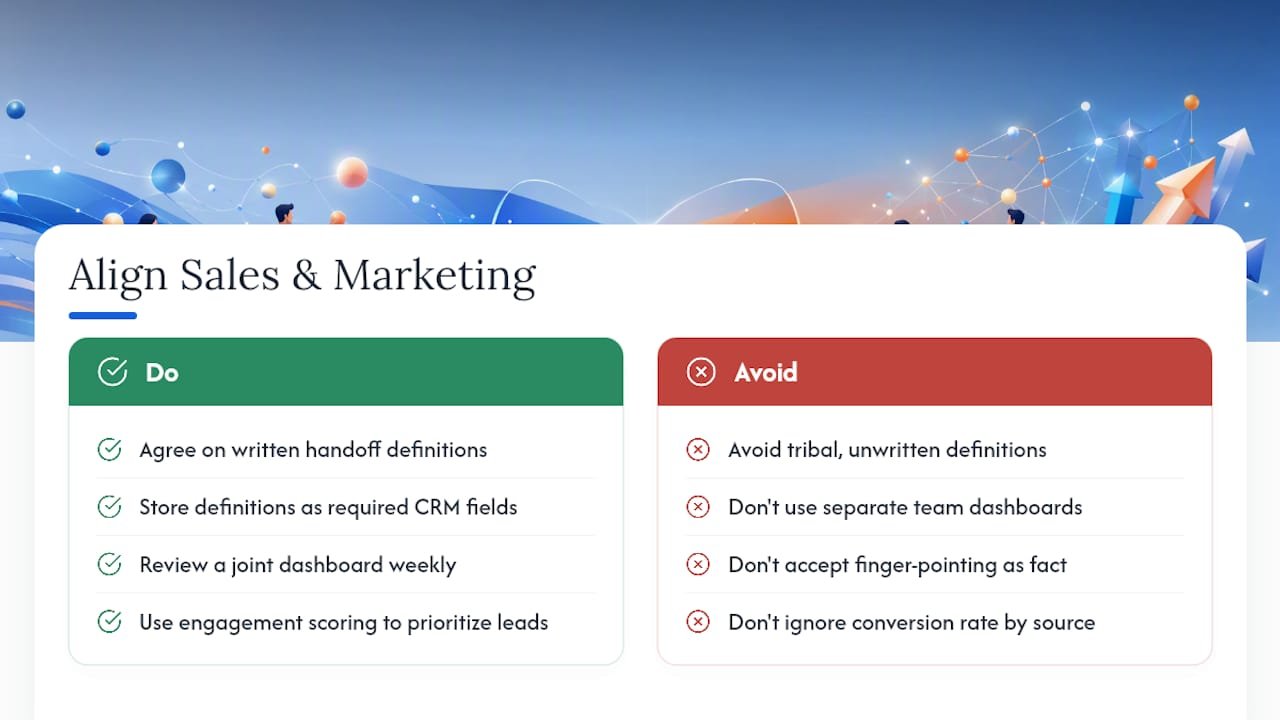
Sales and marketing misalignment almost always traces back to a disagreement over definitions before it’s ever a disagreement over strategy. If marketing counts a lead as “qualified” the moment someone downloads a whitepaper, and sales only considers a lead qualified after a discovery call confirms budget and authority, every conversion metric between the two teams will be distorted before either side even opens a dashboard.
Start by agreeing on a single, written definition of every handoff stage: what counts as a marketing-qualified lead, what counts as a sales-accepted lead, and what counts as a sales-qualified opportunity. Put the definition in the CRM as a required field, not a tribal understanding passed down in onboarding conversations.
Once definitions are shared, build a joint dashboard that both teams look at in the same weekly meeting, showing lead volume by source next to conversion rate by source. This turns “marketing sent us bad leads” from an opinion into a testable claim. If a channel produces high volume but low sales-qualified conversion, that’s a joint problem to solve, not a sales complaint to absorb quietly.
Engagement data, how AI-enabled tools now track and score marketing touchpoints before a lead ever reaches a rep, gives both teams a shared, earlier signal of intent. When marketing can see which leads are genuinely engaging before sales even makes first contact, prioritization improves for both sides, and the finger-pointing over lead quality tends to fade because everyone is finally looking at the same numbers.
Future-proofing pipeline analytics
Automate data quality first. Layer real-time AI signals on top, with human oversight, not instead of it. Measure success against forecast accuracy and deal throughput, not dashboard adoption alone.
— Don
Turn this playbook into a running system
Reading the framework is one thing; running it every week without someone manually stitching together CRM exports and spreadsheet formulas is another. Brainiacconsulting’s AI Analytics Platform and governed AI Analyst automate the enrichment, stage validation, and engagement scoring this article walks through, so your team spends its time on the interventions, not the data cleanup.
Clients typically see cleaner pipeline data within weeks, faster lead-to-opportunity conversion, and forecasts leadership actually trusts instead of quietly discounting. The Atlas AI Operations Platform centralizes CRM, marketing automation, and engagement signals into the same governed system, so coverage, conversion, and velocity numbers come from one source instead of three conflicting exports. If you’re ready to see what that looks like against your own pipeline, start with a consultation through Brainiacconsulting’s AI analytics offering and bring your last two quarters of CRM exports to the first call.
Sources
- How to conduct a pipeline review with analytics
- Pipeline Analytics Template
- What Is Sales Funnel Analysis? Metrics, Stages, Framework | Apollo
FAQ
What is the most important sales pipeline analytics metric?
Coverage ratio paired with stage-to-stage conversion carries the most forecasting weight, since coverage tells you if you have enough deals and conversion tells you if they’re actually moving.
How often should you review pipeline analytics?
Run tactical reviews weekly, trend analysis monthly, and structural reviews (stage definitions, capacity, coverage targets) quarterly.
What is a good pipeline coverage ratio?
Most teams target roughly 3x qualified pipeline against quota, though the right multiple depends on your historical win rate and should adjust seasonally.
How does AI improve sales pipeline analytics?
AI shifts analysis from static weekly reports to continuous monitoring that flags at-risk deals and suggests specific next actions, often before a human would notice the gap. Platforms like Brainiacconsulting’s governed AI Analyst apply this directly to CRM data without requiring a system replacement.
What’s the difference between pipeline management and pipeline analysis?
Pipeline management is the operational, deal-by-deal updating of stages and next steps; pipeline analysis is the aggregate study of conversion patterns and velocity used for forecasting.