

B2B funnel analysis means measuring how many accounts move from one stage of your buying journey to the next, how long each move takes, and where they stall or disappear. Done well, it tells you which single stage deserves your next dollar and your next sprint. Done badly, it produces two reports from the same CRM that disagree with each other.
This guide walks through how we approach it: defining transitions first, choosing a short list of metrics, building a dashboard people trust, and reading the results in a world where buying groups are large and mostly invisible to your sales team.
TL;DR
- A funnel is a chain of denominators. Write down who can complete each step, what counts as completion and which system holds the evidence before you pull a single number.
- Track five to seven metrics, not thirty. Sales velocity is the one that ties volume, deal size, win rate and cycle time together.
- Most of the buying journey happens where you cannot see it, so measure at the account level and use multi-touch attribution rather than last-click.
- A funnel dashboard is only as good as its identity rules. If a contact and its account are not stitched together, every conversion rate is suspect.
Table of Contents
- What B2B funnel analysis actually answers
- Start with definitions, not dashboards
- The stages worth measuring
- Five to seven metrics that earn their place
- Why the modern buying journey changes how you read the funnel
- Fix account identity before you trust any rate
- Building a funnel analysis dashboard people use
- A five-step process you can run this quarter
- Common mistakes in B2B funnel analysis
- Our perspective: treat the funnel as a decision tool
- Where we can help
- FAQ
- Sources
What B2B funnel analysis actually answers
The funnel is a model, not a law of nature. Top results for this topic describe anything from four stages to eight, and the HubSpot guide to conversion funnels notes that most lead generation funnels use four: awareness, consideration, conversion and loyalty. The label matters far less than the questions the model lets you answer:
- Where do qualified accounts stop moving?
- Is the drop caused by volume, quality, speed or a handoff?
- Which channels and segments produce pipeline that closes, not just leads that convert to the next stage?
- What will revenue look like next quarter if nothing changes?
If your analysis cannot answer at least the first two, it is a report, not an analysis.
Start with definitions, not dashboards
The most common failure we see is building charts before agreeing on what a stage is. The team at Edikka makes the point well in its B2B conversion funnel guide: a useful funnel identifies who could complete each step, what counts as completion, when it happened and which system holds the evidence.
The same guide recommends writing seven fields for every transition before you analyze the period:
| Field | The question it settles | Example for MQL to SQL |
|---|---|---|
| Population | Who is eligible to make this move? | Contacts that reached MQL status in the period |
| Completion event | What counts as done? | Sales accepts the lead and creates an opportunity, not merely a click or a call booked |
| Identity rule | How do we know it is the same person or account? | Matched on account ID, not email alone |
| Window | How long do we wait? | 60 days from MQL date |
| Source | Which system is the record of truth? | CRM stage history, not a marketing automation flag |
| Exclusions | Who is removed, and why? | Existing customers, partners, internal test records |
| Limits | What can this number not tell us? | Does not prove the channel caused the outcome |
That last field is the one teams skip. A conversion rate describes what happened. It does not, on its own, explain why. Treating clicks as completed outcomes, padding the denominator with unqualified traffic and confusing correlation with causation are the traps the same guide warns about, and all three vanish once the definitions are written down.
When marketing and sales each define “qualified” differently, you get what Edikka calls two truths from one CRM. We would rather you spend a week on a definitions document than a quarter arguing about whose slide is right.
The stages worth measuring
Use the stages your sales motion really has. For most B2B teams that is some version of this:
- Visitor or known account to lead: an identified person shows intent.
- Lead to marketing-qualified: the lead meets your fit and engagement rules.
- Marketing-qualified to sales-accepted or sales-qualified: sales agrees the lead is worth working.
- Sales-qualified to opportunity: a real buying conversation with a scoped problem.
- Opportunity to closed-won: a signed contract.
- Post-sale: expansion, renewal and retention, if revenue after the first deal matters to your model.
If you run account-based motions, shift the unit from the lead to the account. A single buying group can generate half a dozen contacts, and counting each as a separate funnel entry will flatter your top-of-funnel numbers and depress every conversion rate below it.
Five to seven metrics that earn their place
The temptation is to chart everything. Salesforce’s B2B marketing funnel guide advises tracking only five to seven metrics that show where the pipeline is actually leaking, and warns that lead volume on its own can hide deeper problems. We agree. A workable set looks like this:
- Stage-to-stage conversion rate for each transition, using the definitions above.
- Time in stage (median, not just average, because a few stalled deals distort the mean).
- Pipeline created by source and segment, in dollars rather than lead counts.
- Win rate on qualified opportunities.
- Average deal size.
- Sales cycle length.
- Sales velocity, the combined measure.
Sales velocity brings together opportunity volume, deal size, conversion rate and cycle time into one number, which is why industry leaders favour it as a health check. The practical value is diagnostic: if velocity drops, you look at which of the four inputs moved. A longer cycle with steady win rate is a different problem from a stable cycle with falling deal size.
If you want to see how that calculation looks when it is broken out by segment, this walkthrough on pipeline velocity in dollars per day shows one way to pull it from CRM data. For our own view of which leading indicators matter most for forecasting, see our AI sales pipeline analytics playbook.
A worked example
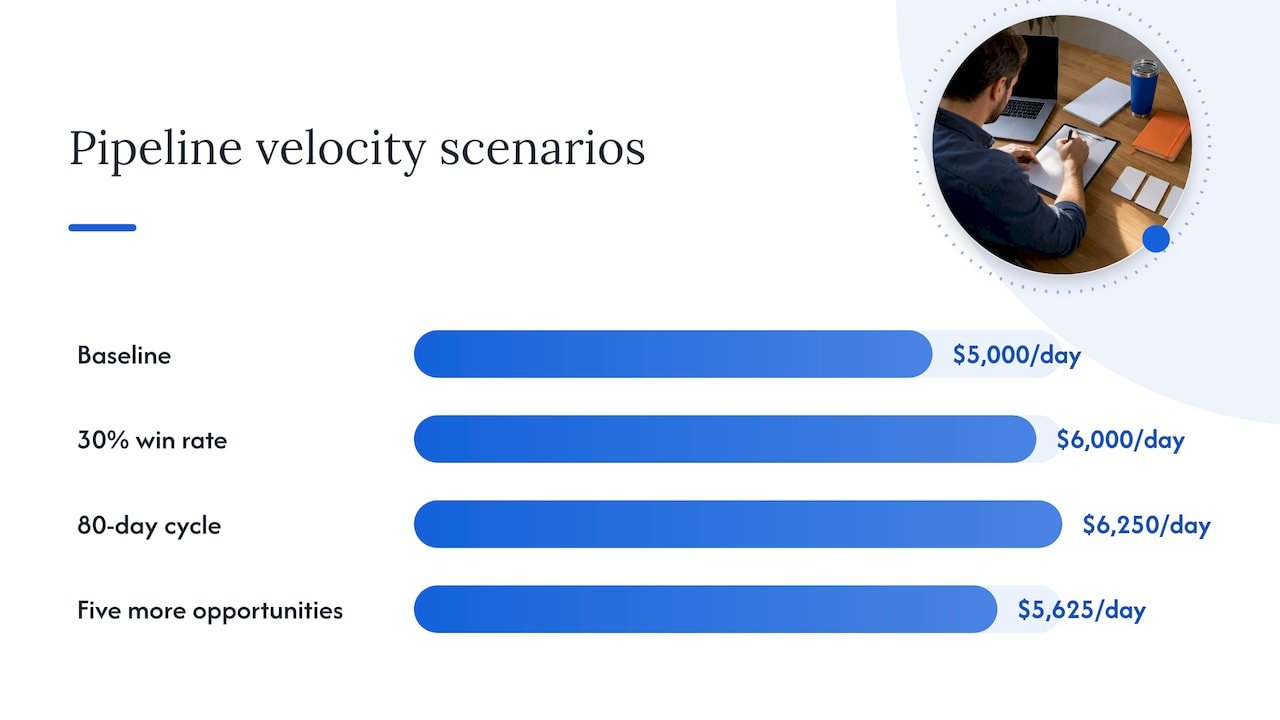
Suppose a services firm works 40 qualified opportunities in a quarter, with an average deal of $50,000, a 25% win rate and a 100-day cycle. Velocity is 40 × $50,000 × 0.25 ÷ 100, or $5,000 per day. This is an illustration, not a benchmark.
Now test the levers. Raise the win rate from 25% to 30% and velocity rises to $6,000 per day. Cut the cycle from 100 days to 80 and it reaches $6,250 per day. Adding five more opportunities lifts it to $5,625. The point is not the arithmetic. It is that you can rank improvements by effect before you commit budget to any of them.
Why the modern buying journey changes how you read the funnel
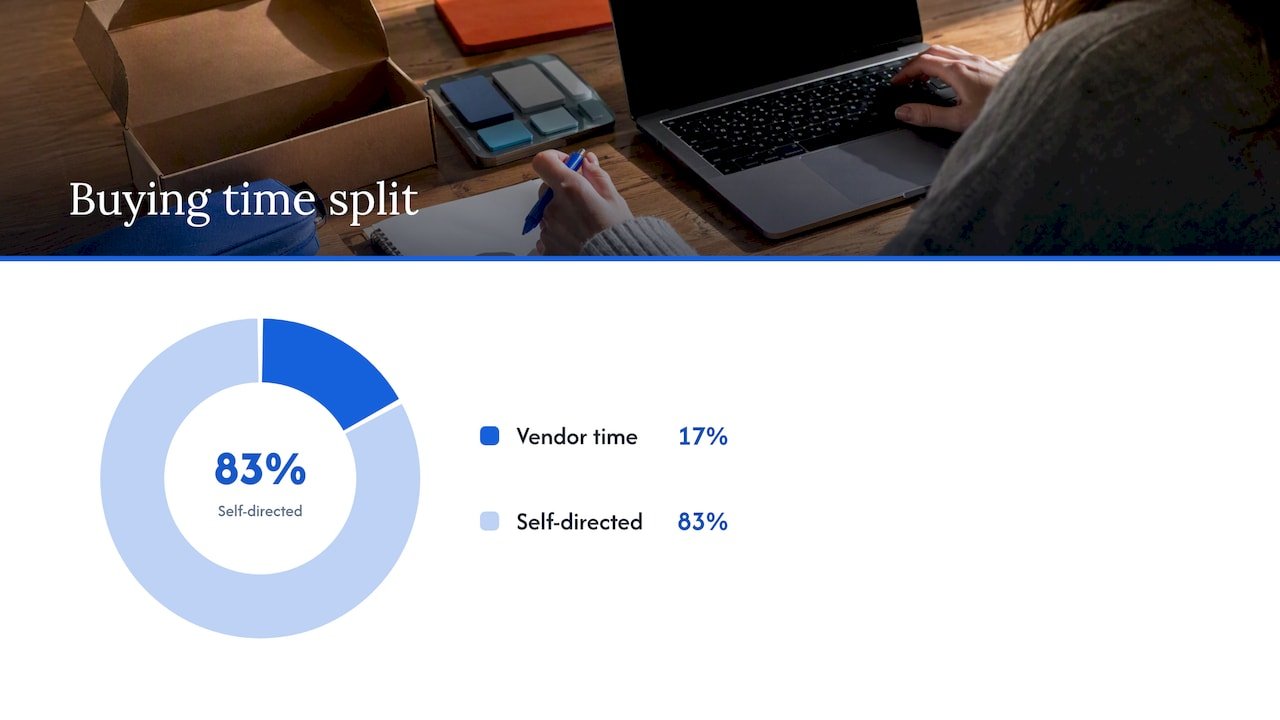
A funnel drawn from your CRM only shows the part of the journey that reached you. Research compiled by ValueNova reports that 83% of the B2B buying journey now happens digitally without sales present, that buying groups typically involve 6 to 10 decision-makers, and that cycles average 211 days. Gartner data summarized by Buyer Enablement puts the time buyers spend with vendors at 17% of total buying time, with the other 83% self-directed through digital research, internal discussion, AI-assisted evaluation and peer consultation.
Three consequences follow for your analysis.
Early stages are under-recorded. Much of the research happens before anyone fills in a form. A low visitor-to-lead rate may reflect a buyer who is well informed and simply not ready, not a weak page.
Contacts are not buyers. With 6 to 10 people involved, one champion converting tells you little. Measure how many distinct roles from an account have engaged, and when.
Single-touch credit misleads. The same ValueNova summary points to multi-touch models such as W-shaped or full path for crediting influence across long cycles. Attribution is a map rather than a courtroom verdict: it shows the terrain, and it is not proof of a single cause. Our piece on what marketers get wrong about attribution goes deeper on that distinction.
There is also a human side. Gartner research, as relayed by ValueNova, suggests buyers avoid reps because they want to skip high-friction, transactional calls, not because they dislike guidance. They save rep time for resolving conflicting information inside the buying group. So when you see a stage where deals stall after a rep gets involved, ask whether the rep is helping the group agree, or only presenting features.
Fix account identity before you trust any rate
Every metric above depends on matching activity to the right account. If a webinar attendee, a demo requester and a closed-won contact sit under three different records, your funnel will show three small leaks instead of one healthy path. We cover this in our analysis of B2B account identity in buyer journey analytics.
Enrichment helps here. Verifying who is on a buying committee, ideally against a second source, reduces the number of orphan records, and this guide to finding and verifying decision makers describes a practical approach. Our own AI lead enrichment pipeline stages show how we structure the same work for GTM teams.
Building a funnel analysis dashboard people use
A good dashboard answers a question in under a minute. A marketing funnel dashboard in a tool like Metabase tracks visit, lead, activation and customer by channel and campaign in one governed view, which is the right instinct for any stack: one definition per metric, one place to look.
What we put on the first screen:
- The funnel itself, with counts and conversion rates between stages, filterable by segment, source and time period.
- Median time in stage next to each conversion rate.
- Pipeline created and pipeline won in dollars, by source.
- Sales velocity with its four inputs shown beside it.
- A cohort view, so you compare leads that entered in the same period instead of mixing old and new.
What we keep off it: vanity totals such as raw lead counts or page views with no downstream link.
Cohorts versus snapshots
A snapshot funnel divides this month’s closed deals by this month’s leads, and the answer is almost always wrong in a long-cycle business. With a 211-day average cycle, last month’s leads have not had time to close. Use cohorts: take everyone who became an MQL in January, then watch what share reach each later stage over the following months. Only then can you compare January with February fairly.
A five-step process you can run this quarter
- Write the transition definitions. Fill in the seven fields for each stage and get sales, marketing and finance to sign off.
- Audit the data. Check stage history in the CRM for missing dates, skipped stages and duplicate accounts. Fix identity rules first.
- Compute cohort conversion and time in stage. Do it by segment, because blended rates hide the fact that one industry or deal size may carry the whole funnel.
- Locate the biggest gap. Compare each transition against your own history first, and treat outside benchmarks as rough context, since they vary widely with deal size, channel and sales motion.
- Run one experiment on that gap. Change one thing, such as a routing rule, a follow-up speed or an offer, and measure it against a holdout. Then repeat.
On step four, be sceptical of any single benchmark table. Published conversion rates for the same transition differ by multiples between sources, because the definitions differ. Your own trend is the most reliable comparison you have.
Common mistakes in B2B funnel analysis
- Counting clicks as outcomes. An email click is activity. A scheduled discovery call with a qualified buyer is an outcome.
- Inflating the denominator. Including unqualified traffic or existing customers makes a stage look weaker than it is.
- Ignoring the handoff. Many leaks sit between marketing and sales, in response time, ownership or rejection reasons that nobody records. Add a required reason code on every rejected lead.
- Blending segments. An enterprise cycle and a mid-market cycle belong on separate lines.
- Reading correlation as cause. A channel that touches many winning deals may simply be where good buyers already were.
- Reporting once. The funnel is a living instrument. Review it on a fixed cadence.
Our perspective: treat the funnel as a decision tool
We work with marketing, sales and finance teams that already have plenty of data. What they lack is agreement and visibility. The funnels we are asked to fix rarely fail on math. They fail because definitions drift, identity is broken across systems, and the report cannot be traced back to a record anyone can inspect.
That is why we build with open-source methods and integrate with the platforms teams already run, including Salesforce, HubSpot, Marketo, Power BI and Tableau. No black boxes: when a conversion rate moves, you should be able to follow it back to the underlying rows. Automation earns its place when it removes manual data handling, such as enriching leads, flagging stalled opportunities and keeping pipeline records clean. It should not obscure how a number was produced.
Our advice is to start small. Pick one transition, define it rigorously, instrument it end to end and improve it. A single trustworthy stage tells you more than a dashboard of twenty doubtful ones, and it gives your team the confidence to extend the method.
— Don
Where we can help
If your funnel numbers disagree between systems, or you know where deals stall but not why, our team can help you build the measurement layer and the automation on top of it. We offer revenue attribution services, marketing operations optimization and support, and an AI readiness assessment and roadmap for teams deciding where agents and analytics fit. You can also see how we approached a lead-to-opportunity conversion case.
FAQ
What is the difference between a sales funnel and a marketing funnel?
The marketing funnel covers the path from awareness to a qualified lead, while the sales funnel picks up from qualification through to a signed deal. In practice they are one revenue funnel with a handoff in the middle, and that handoff is where most leaks occur. Analyze them together using shared definitions.
Which B2B funnel metrics should I track first?
Begin with stage-to-stage conversion, time in stage, pipeline created, win rate, deal size, cycle length and sales velocity. That is seven, which fits the five to seven range Salesforce recommends. Add more only when a specific question demands it.
How often should I review funnel analysis?
Review operational metrics such as pipeline created and time in stage monthly, and cohort conversion each quarter. Long sales cycles mean weekly changes are mostly noise. Review definitions whenever your sales process or CRM stages change.
What should a funnel analysis dashboard include?
Include the staged funnel with conversion rates, median time in stage, pipeline in dollars by source, and sales velocity with its inputs. Filter by segment and cohort. Keep one governed definition for each metric so marketing and sales read the same number.
Sources
- Value Selling Statistics 2026: B2B Benchmarks, ValueNova
- Data and Stats, Buyer Enablement
- B2B conversion funnel: stages, KPIs and measurement, Edikka
- B2B marketing funnel guide, Salesforce
- How conversion funnels create a better customer journey, HubSpot
- Marketing Funnel Dashboard, Metabase