Model drift monitoring means checking, on a schedule and with clear owners, whether the data going into a model and the answers coming out of it still look like the conditions the model was built for. The checks that matter most are the ones tied to a business outcome, such as lead quality, forecast accuracy or attributed revenue, because a model can drift without a single error message. We design and operate AI agents and analytics systems for marketing, sales and finance teams, and the pattern is consistent: a drift alert that nobody owns, or that is not connected to a decision, is just another dashboard tile.
This guide explains the terms in plain language, shows what to monitor, how detection works, what to do when answers arrive late, and how to turn an alert into an action. It also covers how monitoring changes for large language model (LLM) applications.
TL;DR
- Model drift is a decline in a model’s performance over time because the real world has moved away from the data it learned from. Data drift is one cause, and it can be measured before performance visibly drops.
- Monitor three layers: input data, model outputs, and business results. Input and output checks warn you early, and business results confirm the damage.
- When true outcomes arrive late, as with closed-won deals or loan defaults, track proxy signals now and reconcile them against real outcomes later.
- Every alert needs an owner and a defined response: ignore, investigate, recalibrate, retrain or roll back.
- LLM applications need their own checks: a fixed test set of prompts, output quality scoring and tracking of provider model-version changes.
Table of Contents
- What model drift means, in business terms
- Data drift, concept drift and performance decline
- How drift detection works
- What to monitor: three layers
- When the right answers arrive late
- From alert to action
- Monitoring LLM applications
- A starting setup for a small team
- Our perspective
- Put monitoring in place with Brainiac
- FAQ
- Sources
What model drift means, in business terms
Stanford HAI defines model drift as the degradation of a machine learning model’s performance over time because real-world data has changed from the data used in training. Its examples include a fraud-detection model built before the pandemic and recommendation systems that fall behind as people’s preferences evolve.
The marketing and sales equivalents are easy to recognize:
- A lead-scoring model trained on last year’s buyers keeps promoting a segment that has stopped converting, because a new competitor or pricing change shifted who buys.
- A churn or intent-prediction model keeps running after a CRM migration changed how a field is filled in.
- A forecast built on pre-campaign traffic patterns starts missing because a new channel now brings different visitors.
In each case nothing crashes. The model returns a score, the dashboard stays green, and the numbers are slightly wrong in a way that compounds. That quiet failure is why monitoring is a discipline of its own, separate from uptime monitoring.
Data drift, concept drift and performance decline
Three terms get used interchangeably, and separating them makes alerts much easier to act on.
Data drift is a change in the statistical properties of the model’s inputs. NVIDIA’s guide to monitoring models in production describes it as a shift in feature values over time, and describes model drift as the decay of predictive power caused by real-world change. Example: the average deal size entering your scoring model doubles because sales started targeting larger accounts.
Concept drift is a change in the relationship between inputs and the outcome. The inputs may look the same, but what they mean has changed. Example: a webinar attendance used to signal strong buying intent, and now it mostly signals people collecting content.
Performance decline is the visible result: accuracy, precision, forecast error or conversion from model-qualified leads falling. It is the thing you care about, and usually the last thing you can measure, because it depends on outcomes that take time to arrive.
The practical difference: data drift can be detected immediately without knowing the right answers, but it does not always hurt performance. Performance decline is real harm, but it is delayed. A sound monitoring setup uses the first as an early warning and the second as confirmation.
How drift detection works
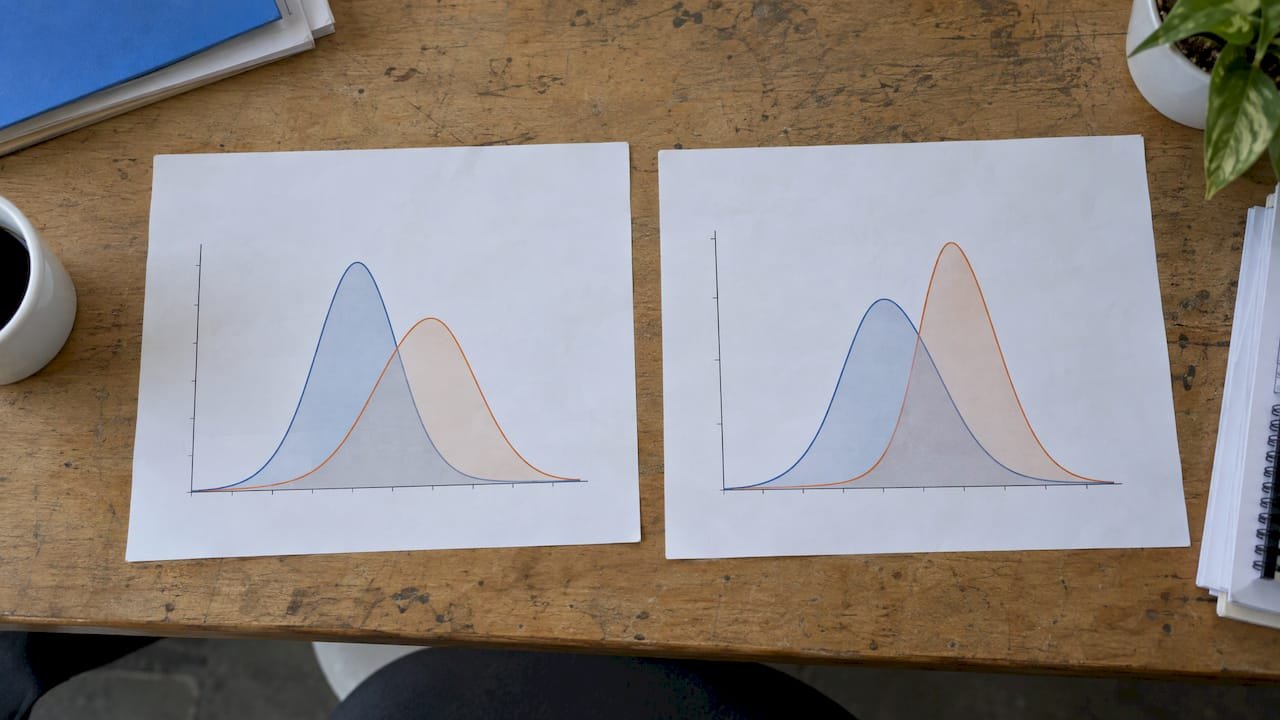
Most detection compares a reference window with a current window. The reference might be the training data or a recent period when the model behaved well. The current window is what the model sees now. A statistical test then asks whether the two are different enough that chance alone is an unlikely explanation.
An IBM Research paper on automatic data drift detection describes one approach: running a two-sample test, such as the Kolmogorov–Smirnov test, on the distribution of a classifier’s confidence scores between a baseline set and production data, and raising an alert when the two are significantly different. A two-sample test simply asks whether two sets of numbers plausibly came from the same source.
You do not need to run the mathematics yourself to make good decisions, but you do need to settle four things:
- The reference window. Pick a period that represents healthy behaviour. For a business with strong seasonality, a rolling comparison against the same weekday or the same season last year is fairer than a single fixed training snapshot.
- The features to watch. Start with the inputs that drive the model most, not all of them. Testing hundreds of fields at once guarantees some false alarms.
- The threshold. Thresholds are conventions, not laws. Calibrate them against how sensitive your model actually is: begin with a soft alert that prompts a look, and a hard alert that triggers a defined response.
- The persistence rule. Require the signal to stay elevated across several consecutive windows before escalating. A single odd Monday after a holiday should not retrain your model.
The usual false-alarm sources are seasonality (weekends, holidays, promotions) and the sheer number of features tested. Matching the reference to the same season and requiring persistence handles most of both.
What to monitor: three layers
Google’s production guidance for machine learning recommends watching serving data against training data, prediction skews, missing or corrupted values, quota use and model-quality proxies, and tracking the surrounding pipeline (training time, failures, validation-set drift), not only the live endpoint. Organizing those into layers keeps it manageable.
| Layer | What to watch | Why it matters | Typical owner |
|---|---|---|---|
| Inputs | Distribution of key features, missing values, schema or field changes, outliers | Catches broken integrations and market shifts before scores change | Data or marketing operations |
| Outputs | Score distributions, confidence, share of records in each class, calibration | Shows the model behaving differently even when labels are unavailable | Analytics or data science |
| Outcomes | Accuracy, precision and recall, forecast error, conversion of model-qualified leads, revenue per segment | Confirms whether drift is costing money | Business owner (sales, marketing, finance) |
| System | Latency, failures, throughput, cost | Separates a slow or broken service from a drifting model | Engineering or platform |
The Singapore government’s MLOps playbook lists the standard measures at the outcome layer: accuracy, precision, recall and F1 for classification, error measures such as MAE and RMSE for regression, and differences in results across demographic groups. It also lists system measures such as API latency and failure rate. Uber describes tracking availability, latency, score distributions, calibration, null rates and statistical drift in its own deployment safety practice, which shows that large operations watch several layers at once rather than a single accuracy number.
For a small or mid-sized business the same principle scales down. You do not need forty charts. You need one input check, one output check and one business metric per model, each with a name next to it.
Tie one business metric to each model
This is where most programs go wrong. A data scientist monitors statistical drift, a revenue leader monitors pipeline, and nobody connects the two. For each model, pick the number the business would use to judge it:
- Lead scoring: conversion rate of high-scored leads to opportunities, by segment.
- Attribution or marketing mix models: stability of channel contribution estimates against spend and holdout tests.
- Forecasting: forecast error by week against what actually closed.
- Customer intent prediction: share of predicted-intent accounts that engage within a set time.
Our page on making predictive lead scoring actionable covers the signals, backtests and CRM steps that sit behind the first example.
When the right answers arrive late
The hardest practical problem for revenue teams is that ground truth is slow. A B2B deal can take months to close. A customer’s lifetime value takes longer. Many predictions never get a label at all.
Google’s guidance is to compare serving data and predictions against their earlier behaviour and to instrument proxy metrics when ground truth is unavailable. Its example is a spam filter: track the share of messages users move to spam. A rise from 0.5% to 3% can signal a potential issue, and changes in the proxy are more informative than its raw level.
The marketing equivalents of that proxy:
- The share of leads that sales rejects within a week of assignment.
- The share of model-qualified leads that book a meeting.
- The average score of newly created records compared with the previous period.
- The proportion of records where enrichment returns blank fields.
A 2025 NeurIPS paper on estimating model performance under covariate shift without labels makes a distinction worth remembering. Detecting that input data has changed is not the same as knowing how much performance has changed. Input-drift signals alone do not tell you the direction or size of the impact, and the authors propose estimating performance directly from unlabeled data, with confidence intervals, under stated assumptions.
The workable routine is layered. Watch the proxies continuously. When real outcomes arrive, reconcile them against what the proxies said, and use the confirmed and unconfirmed alerts to adjust thresholds. After a few quarters, your alerts reflect how your own business behaves rather than a generic default.
From alert to action
A drift score is useful only if it drives a decision. Write the decision table before the first alert fires.
- Below the soft threshold: do nothing and keep logging.
- Soft alert: the owner checks whether the cause is benign. Was there a campaign, a holiday, a pricing change, a new lead source or a CRM field change?
- Confirmed input problem: fix the pipeline. A broken field mapping or an integration that started sending nulls is a data-quality incident, not a modelling problem.
- Confirmed real-world change: choose among recalibrating the scores, retraining on recent data, updating features, or adding a human review step while the model is repaired.
- Bad new version: roll back. Google’s guidance is to release a model to a subset of users first, and if it does not behave as expected, roll it back and diagnose the problem.
A retrained model should earn its place. Promote it only if it beats the model currently in production on a recent, fresh sample, and release it to a small share of traffic or a single team first. That is the difference between a monitoring program and an automatic way to ship an untested model.
To find the cause of an alert, look at which features drifted most, then check whether those features matter much to the model. Many inputs can drift with no effect on predictions, and a small change in one heavily weighted feature can move everything.
Monitoring LLM applications
LLM drift behaves differently because the output is free text, and quality is multidimensional and depends on the use case. There is also a cause you do not control: the provider can change the model version behind an interface, or alter safety filters, so identical prompts start returning different answers.
The practical monitoring set for an LLM-based assistant, summarizer or agent:
- A fixed test set of representative prompts, run on a regular schedule, scoring format compliance, length and meaning against saved good answers. One practitioner guide on prompt sensitivity drift recommends exactly this kind of recurring golden-prompt check.
- Retrieval checks if the application searches your documents: a held-out set of questions with known correct passages, so a change of embedding model or a re-indexing job shows up as a drop in retrieval quality.
- Quality dimensions: faithfulness to the source, relevance, correctness and hallucination rate, scored by reviewers or a calibrated automated judge.
- Operational signals: latency, error rate, token use and cost per task.
- Provider changes: log the model version on every call so that a change in behaviour can be matched to a change in version.
If your concern is how different AI models describe or cite your brand, an audit across multiple AI models gives you a quick side-by-side view of how each one answers, which is a useful baseline to repeat over time.
For agents that take actions in a CRM or marketing platform, add traces of each step and clear ownership. Our guides on agent observability and CRM workflow observability cover what to log, who gets the alert and how recovery works.

A starting setup for a small team
You can put a credible program in place in a few weeks without a dedicated platform team.
- Inventory the models. List every model or agent that influences a revenue decision: scoring, routing, forecasting, attribution, recommendations, LLM assistants.
- Assign an owner and a business metric to each.
- Save a baseline. Store a snapshot of inputs, outputs and the business metric from a healthy period.
- Choose five to ten input features and two output measures per model. Resist watching everything.
- Set soft and hard thresholds, plus a rule that a signal must persist across several windows before it escalates.
- Write the response for each alert level, including who can approve a retrain or a rollback.
- Review monthly. Count alerts that were real, benign and false, and adjust the thresholds accordingly.
Our guide on evaluating whether an AI analytics platform is accurate enough is a good companion when the model in question produces the answers your leaders read in reports.
Our perspective
Most drift programs fail for organizational reasons, not statistical ones. The test is in the data, but the decision belongs to a person, and that person has to know the alert exists, understand what it means for pipeline or revenue, and be allowed to act.
That is why we build monitoring as part of the system, not as a bolt-on. When we design and operate AI agents and analytics systems for marketing, sales and finance teams, we use an open-source approach with integrations into the platforms our clients already run, such as Salesforce and HubSpot, so you can see what the system is doing and why. We avoid black-box solutions because a model you cannot inspect is a model you cannot monitor.
Think of drift monitoring as a map rather than a courtroom verdict. An alert does not prove the model is wrong. It tells you where the terrain has changed and where to look first. Teams that treat it that way investigate calmly, retrain deliberately and keep trust in their numbers.
Our governance and guardrails work, and the AI agent governance implementation framework, put owners, thresholds and responses in place before the first alert, not after the first surprise.
Don
Put monitoring in place with Brainiac
If you have models or agents influencing revenue and no clear picture of who watches them, we can help. Brainiac Consulting designs, deploys and operates production-grade custom agents inside your environment, and builds AI-enabled analytics and governance around them. Our custom agent deployment service is the place to start if you want an agent built with its monitoring and ownership defined from day one. If you are still deciding where AI belongs in your workflows, our AI strategy and readiness advisory covers assessment, prioritization, roadmap, governance and workforce enablement.
To discuss your models and what a monitoring setup should look like for your stack, reach us through brainiacconsulting.io.
FAQ
What is the difference between model drift and data drift?
Data drift is a change in the inputs a model receives, such as different customer mix or a changed field format. Model drift is the decline in the model’s performance that real-world change can cause. Data drift can be measured immediately, while performance decline often shows up later, once outcomes are known.
How often should I check for drift?
Match the schedule to how fast your data changes and how costly a wrong answer is. Input and output checks can run daily or weekly, while outcome checks follow the rhythm of your sales cycle. Review thresholds monthly at first, then quarterly once alerts stabilize.
How can I monitor a model if I do not have the true outcomes yet?
Track proxies: the distribution of scores, the share of leads sales rejects, meeting-booking rates and blank fields from enrichment. Compare each against its own recent history rather than a fixed number. When real outcomes arrive, reconcile them against the proxies so you know which signals predicted real damage.
Does every drift alert mean I should retrain the model?
No. Many alerts come from seasonality, promotions or a broken data feed. Check the cause first, require the signal to persist across several windows, and retrain only when the real-world change is confirmed. A retrained model should beat the current one on fresh data before it replaces it.
How is LLM drift monitored differently?
Because outputs are free text, you score quality with a fixed set of test prompts, retrieval checks and reviewer or calibrated automated scoring, and you log the model version on every call. Provider updates can change behaviour without any change on your side, so version tracking matters.
Sources
- What is Model Drift? | Stanford HAI
- A Guide to Monitoring Machine Learning Models in Production | NVIDIA
- Automatically detecting data drift in machine learning classifiers | arXiv
- Productionization | Machine Learning | Google for Developers
- Model Monitoring and Observability Metrics | Singapore AI Practice MLOps Playbook
- Raising the Bar on ML Model Deployment Safety | Uber
- Estimating Model Performance Under Covariate Shift Without Labels | NeurIPS 2025
- LLM Drift | AI School
- Multi-LLM Audit