A dashboard is best when people need to monitor the same governed measures repeatedly. An AI analyst is best when the next useful question depends on the answer to the last one. Many decisions need both.
The interface should follow the decision pattern, not a claim that dashboards are dead or that conversation replaces business intelligence.
Dashboards provide stable shared views. AI analysts provide flexible exploration and synthesis. Each becomes risky when asked to do the other’s job without the necessary controls.
Choose by the shape of the question
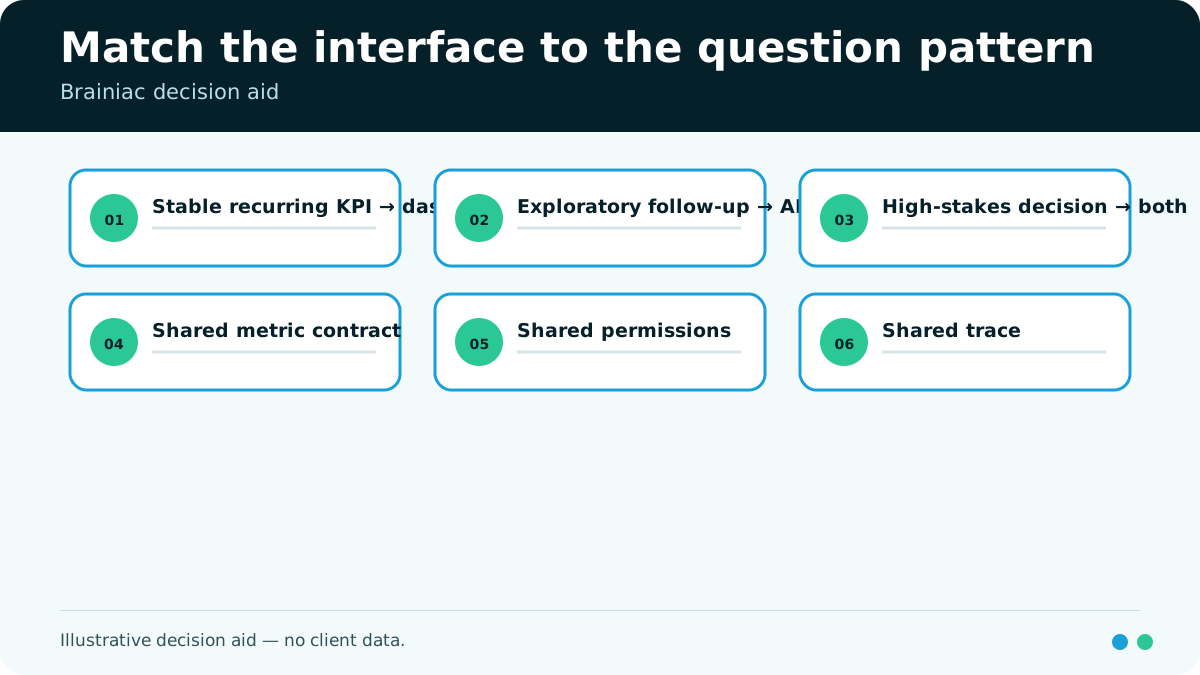
Recurring questions favor a dashboard. “Are we on plan?” and “Which region breached the threshold?” usually need consistent metrics, filters, visual context, and a view that many people can revisit.
Exploratory questions favor an AI analyst. “Why did the region breach?” may lead through product mix, channel, timing, customer cohort, and operational notes. The path is not known in advance.
The key distinction is not charts versus chat. It is stable monitoring versus adaptive inquiry.
A dashboard is a shared contract
A useful business intelligence (BI) dashboard packages decisions the organization has already made about metrics, grain, dimensions, filters, and visual emphasis. That stability is a feature.
Dashboards work well for:
- Repeated operating reviews
- Thresholds and service levels
- Shared scorecards
- Period comparisons
- Exceptions that can be defined in advance
- Regulated or executive reporting with a stable presentation
The viewer should not have to rediscover the definition every week. A well-governed dashboard gives the room a common starting point.
Its weakness is the edge of the model. When the answer prompts an unexpected follow-up, the user may need another report, an analyst, or a data pull. Adding every possible drill path eventually produces a crowded interface that still cannot anticipate every question.
An AI analyst is an inquiry surface
An AI analyst lets a user express a question in ordinary language, clarify intent, retrieve relevant data, generate or select analytical logic, and explain the result. That can shorten the distance between an observation and the next hypothesis.
It works best for:
- Ad hoc exploration inside governed data
- Exception investigation
- Comparing several plausible explanations
- Narrative summaries tied to source evidence
- Translating a business question into a reviewable query or plan
- Preparing a decision brief from several approved sources
Flexibility creates obligations. The system must know which metric definition applies, what data the user may see, how current the data is, which joins are approved, and when the question is too ambiguous to answer.
A fluent answer is not a substitute for those controls.
Compare the decision patterns
| Decision pattern | Better starting interface | Why |
|---|---|---|
| Monitor a known measure every Monday | Dashboard | Stable definition and shared view matter most |
| Investigate an unexpected change | AI analyst | The next question depends on prior evidence |
| Publish a controlled executive scorecard | Dashboard | Presentation and review path should stay consistent |
| Explore a new business question | AI analyst with review | The analytical path is not yet standardized |
| Alert on a known threshold | Dashboard or rule-based alert | A deterministic condition does not need open-ended analysis |
| Explain a threshold breach | AI analyst over governed context | Synthesis and follow-up questions add value |
| Make a repeatable operational decision | Both | Analyst discovers the pattern; dashboard operationalizes it |
This table is a starting point. Risk, data quality, access, and review requirements can change the answer.
The two interfaces share a data contract
A dashboard and an AI analyst should not carry separate definitions of revenue, active customer, qualified pipeline, or on-time delivery. They need the same governed business meaning even if they present it differently.
Current analytics platforms often pair conversational interfaces with semantic definitions, row- and column-level controls, lineage, and audit features. ThoughtSpot’s supply-chain page is one current vendor example of that bundle. Its claims are product-specific, not proof that every AI analyst works this way. ThoughtSpot’s product page is useful as evidence of where the market is heading.
The underlying requirements remain platform-neutral:
- Metric definition and owner
- Grain, dimensions, and approved joins
- User role and data scope
- Freshness and effective time
- Query or analytical-plan trace
- Source references
- Correction and escalation path
Without that contract, the dashboard can institutionalize a wrong number and the AI analyst can improvise one.
Use the analyst to discover, then decide what to standardize
Exploration often reveals a question worth asking repeatedly. That is the point at which an AI analyst’s path can become a dashboard, metric, alert, or workflow.
For example, an investigation may show that a weekly exception is consistently explained by the same three governed dimensions. The team can turn that pattern into a monitored view. The dashboard then handles routine detection, while the AI analyst remains available for unfamiliar cases.
The reverse is also useful. A dashboard identifies where performance moved. The analyst opens the investigation with the same metric, date range, filters, and access context. The handoff should preserve those parameters so the inquiry does not quietly change the question.
Evaluate the interface against the decision
Do not compare products on demonstration polish alone. Test one recurring decision and one exploratory decision.
For the dashboard, inspect whether the measure is trusted, the view supports the meeting or action, and users can spot relevant exceptions without extra reconciliation.
For the AI analyst, inspect whether it asks useful clarifying questions, uses the approved definition, respects access, produces a reviewable trace, and explains uncertainty. Also measure the human effort required to verify the result.
Then ask a harder question: what happens after the insight? A dashboard that nobody acts on and an AI answer with no owner are both incomplete decision systems.
Build the smallest useful pair
The practical design is often one governed dashboard for the common operating view plus an AI analyst for investigation inside the same definitions and permissions. Do not replace a stable scorecard simply because conversation feels modern. Do not force every new question through a dashboard backlog when governed exploration can resolve it safely.
Brainiac can help define the decision, shared metric contract, handoff, and evaluation needed to choose the interface. The goal is not to defend dashboards or promote chat. It is to make the decision faster without loosening the meaning of the numbers.