

Choose Power BI if your company runs on Microsoft 365 and you want broad self-service reporting at a published per-user price. Choose Looker if your data lives in a cloud warehouse such as BigQuery and your priority is one governed definition of every metric. Either way, the tool matters less than the metric definitions, data models and attribution logic you build inside it, and that is where most reporting projects succeed or stall.
This guide is written for marketing, sales, revenue operations and analytics leaders who must pick a platform, or who inherited one and want it to deliver trustworthy numbers.
TL;DR
- Power BI is a self-service-first platform with published US list prices, tight Microsoft integration and a mature modelling layer (Power Query and DAX).
- Looker is a semantic-layer-first platform: metrics are defined once in code (LookML) and every report queries the database live. Google does not publish its prices.
- Looker Studio is not Looker. It is Google’s lighter reporting tool, and mixing the two up is the most common mistake in this comparison.
- Pick by your data stack and team skills first, then by cost, then by AI features.
- Whichever you choose, budget for the modelling and governance work. That is what makes dashboards believable.
Table of Contents
- Looker, Looker Studio and Power BI: what you are actually comparing
- How each tool is built: governed code or self-service models
- Connections, governance and sharing
- What each costs in the US
- Marketing attribution, sales and finance reporting
- AI features: Copilot, Gemini and agents
- Which one fits your situation
- A five-step way to decide
- Perspective: the tool is the visible 10%
- Let us build the foundation under your BI tool
- FAQ
- Sources
Looker, Looker Studio and Power BI: what you are actually comparing
Google sells two products with similar names. Looker is Google Cloud’s enterprise business intelligence (BI) platform, which Google describes as built on a trusted semantic layer. A semantic layer is a shared set of business definitions, such as what counts as “revenue” or a “qualified lead”, that every report draws from.
Looker Studio is Google’s self-service reporting and visualization tool, and Google says it connects to more than 800 data sources. It is quick to start with and well suited to marketing dashboards built on Google data, but it is a different product with a different job.
Microsoft describes Power BI as a platform for self-service and enterprise BI, used to connect to data, visualize it and place visuals inside the apps people already use.
So the real comparison is usually one of two:
- Looker vs Power BI: two enterprise platforms with different philosophies.
- Looker Studio vs Power BI: a lightweight reporting tool against a full modelling platform.
This article covers the first and touches on the second where it changes your decision.
How each tool is built: governed code or self-service models
This is the difference that shapes everything else.
Looker works in-database. According to Google Cloud’s Looker and BigQuery whitepaper, Looker does not ingest your source data. A question asked in Looker is converted into SQL and sent to your database, so answers reflect the freshest data the warehouse holds. Metrics live in LookML files, Looker’s modelling language, which describe tables, joins, dimensions and measures. Because those files are code, they can be versioned, reviewed and tested like any other software.
Power BI builds a model your analysts shape. A Power BI model holds tables, relationships and calculations. Analysts clean and shape data with Power Query and write calculations in DAX, a formula language for measures. Data can be loaded into memory for speed or queried live from the source through DirectQuery, which Microsoft’s connector documentation describes as the mode in which Power BI sends live queries to the source.
What this means in practice
| Question | Looker | Power BI |
|---|---|---|
| Where do metric definitions live? | In LookML code, one shared layer | In semantic models, which can be shared or built per report |
| Who builds the logic? | Developers or analytics engineers comfortable with code and SQL | Analysts and power users working in Power Query and DAX |
| How is data queried? | Live SQL against your database | In-memory import or live DirectQuery |
| Typical strength | Consistent metrics across every report | Fast, flexible self-service and broad adoption |
| Typical risk | Heavier up-front engineering | Several versions of the same metric if no one owns governance |
For a CMO, the practical read is this. If sales, marketing and finance have argued over what a “lead” or “pipeline” means, Looker’s single semantic layer enforces one answer by design. Power BI can reach the same place, but it needs a deliberate shared model and an owner for it.
Connections, governance and sharing
Looker supports the major cloud warehouses, and its model-first approach means access rules travel with the definitions. Google describes Looker’s data model as giving the whole organization a consistent, governed view of data from across multiple clouds, with proactive alerts and deep integrations.
Power BI’s strength is its place inside the Microsoft estate: sign-in through Microsoft accounts, workspaces, sharing and the desktop, mobile and server tools listed on Microsoft’s downloads page. If your people already live in Excel, Teams and SharePoint, adoption tends to be faster because nothing about the surroundings is new.
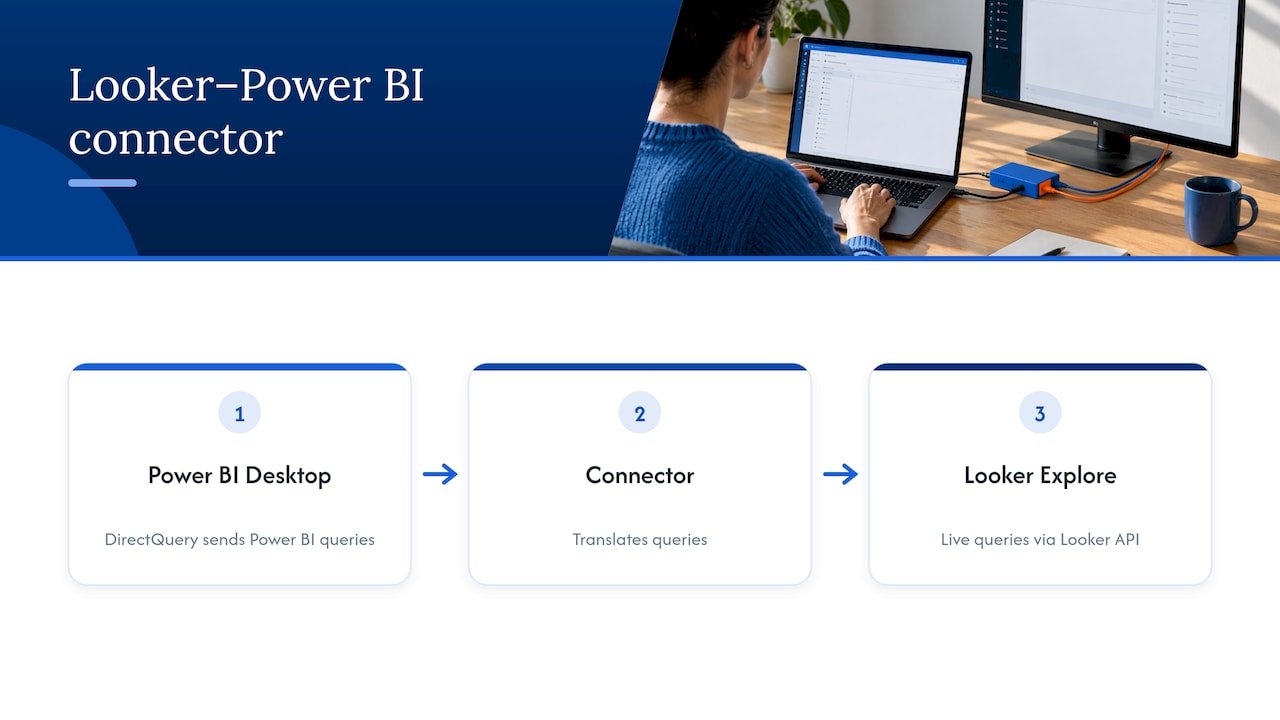
You do not always have to choose. Google documents a Looker–Power BI connector that lets Power BI Desktop connect to a Looker Explore in DirectQuery mode, with the connector translating Power BI’s queries into live queries through the Looker API. That means a team can keep governed Looker definitions and still let analysts build in Power BI.
One governance warning applies to both. Broad access is not governance. Whoever administers either platform needs rules for who can build, who can only view, and which datasets count as certified. Without them, any BI tool drifts toward many dashboards and few trusted answers.
What each costs in the US
Price transparency is the starkest contrast.
Microsoft publishes its US list prices on its Power BI pricing page:
- Free account: $0 (you can build, but sharing needs a paid license)
- Power BI Pro: $14.00 per user per month, paid yearly
- Power BI Premium Per User: $24.00 per user per month, paid yearly
- Fabric capacity: variable pay-as-you-go or reserved pricing
Pro is listed as included with Microsoft 365 E5 and Office 365 E5, which matters if you already license those plans. Prices change, so confirm them on Microsoft’s page before you budget.
Google takes a different route. Its Looker pricing page explains that cost has two components: platform pricing, which covers running a Looker instance, and user pricing, which licenses individual users. It lists three platform editions, Standard, Enterprise and Embed, each including one production instance, 10 Standard Users and 2 Developer Users, with API call allowances that rise by edition. Actual figures come from a sales quote and annual commitment, so you cannot model Looker’s total cost from a public price list the way you can Power BI’s.
How to compare total cost fairly
Licence price is only the first line. Add:
- Viewers vs creators. Count how many people only read dashboards and how many build them. Licence types differ for each.
- Warehouse query cost. Looker queries your database live, so heavy dashboard use shows up on your warehouse bill.
- Build and maintenance time. LookML needs developer skills. DAX needs analyst skills. Either way, someone has to own the model.
- Rollout and training. A cheap licence with low adoption costs more per useful report than a pricier one people actually open.
Marketing attribution, sales and finance reporting
Most teams reading this are not choosing a BI tool for its own sake. They want to know which channels produce pipeline, where leads leak, and whether the finance view matches the marketing view.
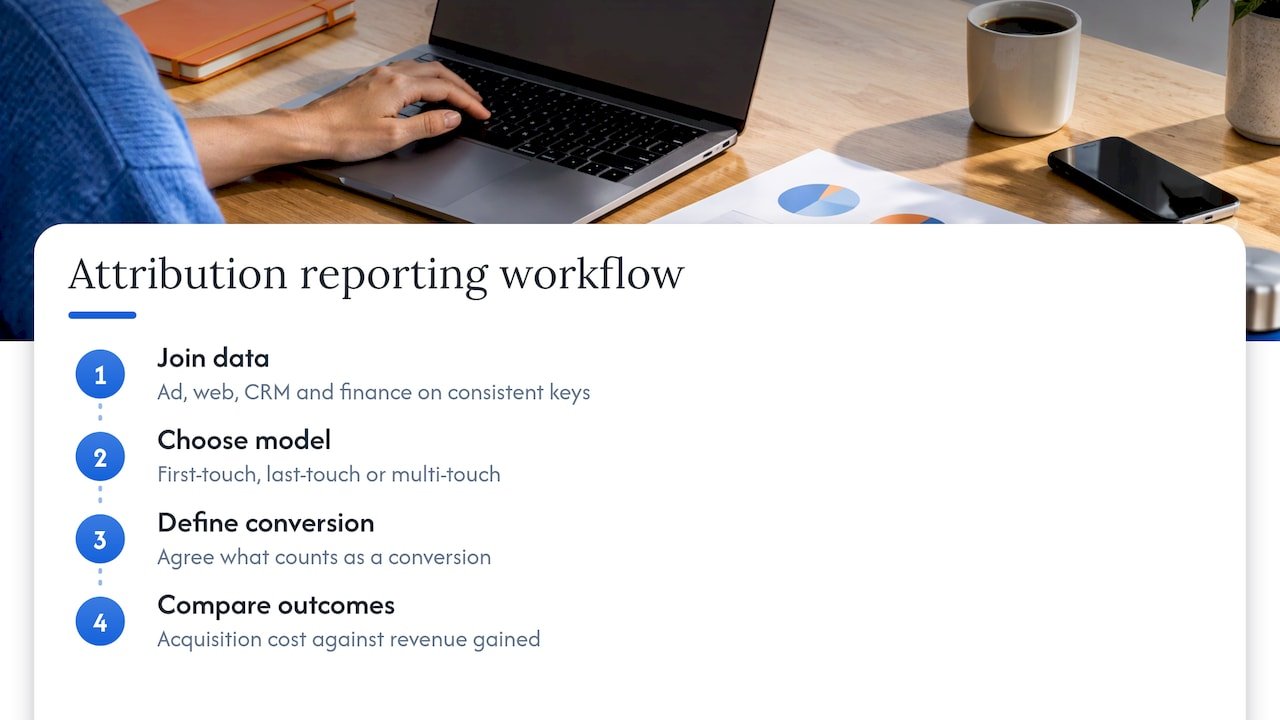
Both platforms can visualize attribution. Neither produces trustworthy attribution on its own. The visualization is the last ten percent. The first ninety is joining ad platforms, web analytics, CRM and finance data on consistent keys, deciding on a model (first touch, last touch, multi-touch) and agreeing what counts as a conversion. Google’s own retail materials, for instance, include a marketing attribution block for Looker that compares first-touch and last-touch revenue by channel and weighs acquisition cost against revenue gained. A template like that gives you a starting shape, not your answer.
The business case for getting this right is well covered in this piece on analytics in marketing ROI.
For sales teams, the question is lead qualification: which leads are likely to convert, and are those signals reaching the CRM? That is a data-pipeline problem before it is a dashboard problem. For finance, the need is reconciled numbers with calculations that behave consistently when filters change, which favours a strong modelling layer, whichever tool supplies it.
AI features: Copilot, Gemini and agents
Both vendors are adding AI. Google presents Looker as an agentic BI platform powered by Gemini, pairing its semantic layer with conversational analytics so people can ask questions in plain language and get answers grounded in governed definitions. Microsoft is building AI assistance into Power BI as part of its wider platform, and its Power BI page positions it as part of the tools people use every day.
A practical point for both: AI assistants are only as reliable as the definitions beneath them. Ask a chatbot for “pipeline by channel” when three definitions of pipeline exist, and you will get a confident answer to the wrong question. Clean semantic modelling comes before AI, not after.
Which one fits your situation
| Your situation | Likely better fit |
|---|---|
| Microsoft 365 shop, many self-service users, predictable per-user budget | Power BI |
| Data in BigQuery or another cloud warehouse, strong engineering team | Looker |
| One strict definition of every metric across the company | Looker, or Power BI with a governed shared model |
| Analysts who know Excel and want to build their own reports | Power BI |
| Customer-facing or embedded analytics inside a product | Looker (Google positions its embedded offering for this) |
| Lightweight marketing dashboards on Google data | Looker Studio |
| Small or mid-sized service business or online store with limited data staff | Power BI, with a modelled foundation built for you |
Many organizations run two tools, one for external-facing marketing dashboards and one for governed internal reporting. That is reasonable when each has a clear job.
A five-step way to decide
- List the decisions the dashboards must support. Pipeline review, channel spend, revenue leakage, board reporting. The tool follows the decisions.
- Map where the data lives. Warehouse, CRM, ad platforms, spreadsheets, finance system. A tool that fits the stack avoids a year of plumbing.
- Write the ten metrics that matter and define each in one sentence. If you cannot, no platform will fix that, and this is the work to do first.
- Assess your team. Do you have people who write SQL and manage code, or analysts who live in spreadsheets? Match the tool to the skills you have or will hire.
- Price the whole picture. Licences, warehouse usage, build time, training and ongoing ownership.
Where teams go wrong: they compare feature lists, buy a platform, then discover that the CRM, ad and finance data were never reconciled. The dashboards look impressive and nobody trusts them.
Perspective: the tool is the visible 10%
We spend most of our time on what happens before and after the dashboard. Teams ask us “Looker or Power BI?” and the honest first answer is: what question must the number answer, and does everyone agree on how it is calculated?
Our view is that attribution works best as a map rather than a courtroom verdict. It shows you the terrain of touchpoints and where pipeline velocity slows, and it only helps if the underlying data is joined, deduplicated and defined once. That is why we build analytics with open-source methods and no black boxes: you should see how each number is produced and be able to change it.
For many marketing, sales and finance teams, Power BI is a strong home for that work because it fits the tools they already use, and it connects to the CRM and marketing platforms we integrate with every day, including Salesforce and HubSpot. Our AI-enabled analytics and agent work then layers on top: enriching leads, predicting intent and keeping reporting current without manual exports.
Pick the platform that suits your stack. Then invest in the model, the governance and the people who own it. That is where the return is.
Don
Let us build the foundation under your BI tool
If your reporting is manual, your numbers disagree across teams, or you want AI agents working from data you trust, our team designs and operates analytics and AI systems for marketing, sales and finance, with integrations across platforms such as Salesforce, HubSpot, Power BI and Tableau. Our Power BI data analytics service covers the modelling and reporting layer, and our AI strategy and readiness work helps you decide what to build first. You can also see our reporting automation plan and case studies, or start from our main page.
FAQ
Is Looker the same as Looker Studio?
No. Looker is Google Cloud’s enterprise BI platform built around a governed semantic layer. Looker Studio is Google’s self-service reporting tool for building and sharing dashboards. They share a brand but differ in modelling depth, governance and how they are licensed.
Is Power BI cheaper than Looker?
Power BI has published US list prices: Pro is $14.00 per user per month paid yearly, and Premium Per User is $24.00. Google does not publish Looker prices; they come from a quote with platform and user components. Compare them on total cost, including warehouse usage and build time, not licence price alone.
Can I use Power BI with Looker data?
Yes. Google’s Looker–Power BI connector lets Power BI Desktop connect to a Looker Explore using DirectQuery. Power BI queries are translated into live queries through the Looker API, so Looker’s definitions remain the source of truth.
Which is better for marketing attribution?
Neither decides attribution for you. Both can display it, but the accuracy depends on joining ad, web, CRM and finance data and agreeing on a model. Choose the tool that fits your stack, then invest in the data model underneath.
Which should a small business choose?
A small service business or online store on Microsoft 365 usually finds Power BI’s per-user pricing and familiar environment easier to adopt. If your data is mostly Google marketing sources and you need simple reports, Looker Studio may be enough to start.
Sources
- Looker: AI Business Intelligence and Embedded Analytics, Google Cloud
- Looker Studio, Google Cloud
- Power BI, Microsoft Power Platform
- Looker and BigQuery Important Considerations, Google Cloud whitepaper
- Looker for Business Intelligence, Google Cloud
- Download Power BI, Microsoft
- Looker–Power BI Connector, Google Cloud Documentation
- Power BI pricing, Microsoft
- Looker pricing, Google Cloud
- Looker Solutions for Retail, Google Cloud
- Looker Embedded, Google Cloud