

Mixpanel is the better default for lean teams that want fast, self-serve funnel and retention answers on a predictable budget. Amplitude is the stronger choice for larger organizations with analysts who will own a governed data model and run deeper behavioral analysis. Either tool only pays off when its events connect to your CRM, your attribution model and the revenue questions your marketing and sales leaders actually ask, and that connection is where most projects stall.
This guide is written for marketing, sales, analytics and digital transformation leaders, not only for product managers. It covers what each platform does well, where the two differ in daily use, what they cost, and how to decide.
TL;DR
- Mixpanel suits teams that need quick, point-and-click funnels, retention and account-level analysis without writing SQL, and want a predictable cost.
- Amplitude suits mid-market and enterprise teams with analyst capacity, because its behavioral cohorts, taxonomy governance and built-in experimentation reward a well-owned data model.
- Both bill by event volume past a free tier, so your real cost depends on how many events you send, not on headcount.
- Neither tool answers revenue questions on its own. The value comes from connecting events to CRM, attribution and reporting.
- Pick on team profile and stack fit first, then confirm with your own event volume against the live pricing pages.
Table of Contents
- The core difference: two philosophies about who does the analysis
- Side-by-side summary
- How reporting and workflows differ by team
- Experimentation, session replay and AI
- Setup, governance and scale
- What each costs, and how it scales
- How to decide in five steps
- Where the real return comes from
- Our perspective
- FAQ
- Sources
The core difference: two philosophies about who does the analysis
Both tools record what people do in a web or mobile product (clicks, sign-ups, purchases) as events, then let you slice those events into funnels, retention curves and cohorts. A cohort is simply a group of users who share a behaviour or a start date, such as everyone who signed up in March and used a feature twice.
Where they differ is in who they assume will do the work. One analyst writing for AboutMartech frames it as different philosophies about who should do the analysis and how deep it should go. Mixpanel was designed so a product manager with no SQL experience can answer most questions without filing a data request. Amplitude was designed so a data team can build durable behavioral models and run governed experiments at scale.
That difference shows up everywhere else. Mixpanel is built around events with properties and point-and-click report builders. Amplitude is built around user journeys, with default views that emphasize cohorts, retention curves and behavioral segmentation over time, according to Growth Analytics Engine’s comparison.
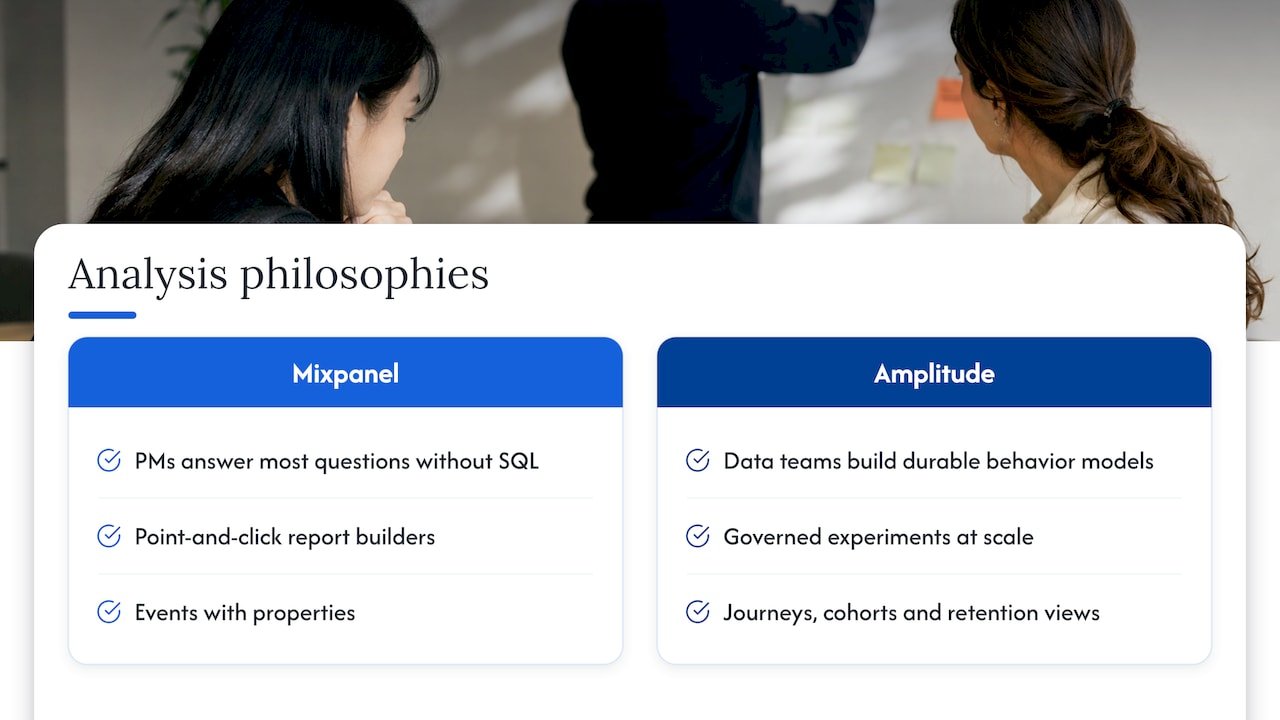
A useful way to hold this: Mixpanel is a fast-moving field notebook, and Amplitude is a surveyed map. The notebook gets you an answer today. The map takes more effort to draw, and then guides many teams over a long period.
Side-by-side summary
| Question | Mixpanel | Amplitude |
|---|---|---|
| Best-fit team | Lean to mid-market teams wanting self-serve answers | Mid-market and enterprise teams with analyst resources |
| Analysis style | Ad-hoc event querying, flexible Insights reports | Journey-based cohorts, retention curves, pathfinding |
| Account-level (B2B) analysis | Group Analytics for accounts, companies or billing IDs | Available, with strength in behavioral cohorts |
| Experimentation | Experiments and Feature Flags now included | Native experimentation module |
| Governance tooling | Lexicon for descriptions and tracking plans | Taxonomy that flags unexpected events and enforces naming |
| Attribution | Nine attribution models | Positioned around behavioral and predictive analysis |
| Pricing basis | Event volume | Event volume |
The rest of this article explains what sits behind each row.
How reporting and workflows differ by team
Marketing and revenue teams
Marketers usually want to know which channels and campaigns bring users who stay and pay. Mixpanel leans into this with nine attribution models, including first touch, last touch, linear, time-decay, U-shaped, J-shaped and custom, plus server-side attribution. Its Revenue Analytics feature connects product usage to financial performance and tracks changes over time, including refunds, charge-backs and subscription changes.
Amplitude’s case for marketers rests on conversion metrics, full-funnel lifetime value and predictive cohorts, as its own comparison page describes.
A caution that applies to both: product analytics sees what happens inside your product. Your pipeline, however, is built from ad clicks, emails, sales calls and contracts that live in other systems. If you want a defensible answer on which touchpoints create revenue, you need those sources joined to the event data. That is a design job, and our revenue attribution services exist for it.
Sales and revenue operations
B2B teams rarely care about one user. They care about the account. Mixpanel’s Group Analytics analyzes behaviour at a customized group level, such as account, company, project or billing ID, so you can ask which companies engage most or which groups convert to a goal event. For a sales team prioritizing outreach, that is the difference between “this user clicked” and “this account is using the feature that predicts expansion”.
If lead qualification is your goal, the product signals matter most when they reach the CRM. Usage thresholds that flag a product-qualified lead should land on the account record, where reps already work. For the funnel view on the sales side, see our guide to B2B funnel analysis.
Analysts and data teams
Analysts tend to prefer Amplitude’s depth. Its behavioral cohorts, which are any sequence of events and property combinations usable as filters in any chart, and its Compass feature for finding behaviours most correlated with retention are described by Growth Analytics Engine as best-in-class. The trade-off is the one Monterail’s Kaja Grzybowska points out: product managers get quick answers from templates, but the advanced analyses pay off most when someone owns the data model and taxonomy.
In practice, ask who that someone is. If you have a named owner, Amplitude’s depth is an asset. If you do not, the simplicity of Mixpanel will get you further sooner.
Experimentation, session replay and AI
Experimentation and feature flags
For years the shorthand was that Amplitude had built-in A/B testing and Mixpanel did not. That has moved. Monterail notes Mixpanel now includes Experiments and Feature Flags on every plan, so most teams no longer need a separate vendor for typical product tests. Amplitude retains a native experimentation module aimed at structured, governed testing at scale, per AboutMartech. Check which plan unlocks which feature on each pricing page before you commit, because limits differ by tier.
Session replay
Both offer session replay, which lets you watch a recording of what a user did. Amplitude’s free plan includes it alongside analytics, experimentation and heatmaps, with frustration analytics that flag rage clicks and dead clicks, according to Amplitude’s replay comparison. Mixpanel’s Growth plan lists replays in volume bands, and its replay SDK also covers Electron desktop apps, which Amplitude’s does not, per Userpilot.
AI features
AI is where both vendors are investing most. Amplitude’s agent analytics gives every plan, including the free one, monitoring for AI agents with 5,000 monthly agent sessions on Free and Plus, rising to 10,000 on Growth and 20,000 on Enterprise. That matters if you are shipping your own AI features and want to connect how agents perform to product outcomes.
Mixpanel’s offer centres on Spark AI queries, a query allowance that rises with the plan, and metric-tree capabilities that link product activity to business outcomes. TechDogs’ 2026 review also lists its security options, including SSO/SAML, SCIM, audit logs and SOC 2 Type II.
The practical point for operations leaders: built-in AI answers questions inside one tool. Agents that act across your stack, for example enriching a lead, updating a CRM field or flagging a leaking funnel step, need to read from these analytics and write to your other systems. That is agent design work, which we cover under custom agent deployment.
Setup, governance and scale
The most underestimated cost of any product analytics tool is not the licence. It is the cleanliness of the data going in.
Fastero’s engineers give a concrete example: with 15 engineers instrumenting events, naming drift such as “button_click”, “Button_Click” and “btn_clicked” becomes a real problem. Amplitude’s Taxonomy lets teams define expected events and properties, flag unexpected ones and enforce naming conventions, while Mixpanel’s Lexicon adds descriptions, hides irrelevant events and manages the tracking plan with less enforcement, as Fastero explains. Fastero also notes Amplitude includes a customer data platform and experimentation, while Mixpanel integrates with a separate data pipeline tool for that role.
Both platforms require technical support to set up and manage event tracking, so budget for engineering time at the start, whichever you choose.
A short governance checklist, whichever tool you pick:
- Write the tracking plan first. List the events, their properties and who owns each, before any code ships.
- Agree naming rules. Pick one case and one verb pattern, and put it in code review.
- Define the identity rule. Decide how anonymous visitors become known users and accounts, because every funnel depends on it.
- Map events to CRM objects. Decide which events become fields on a lead, contact or account.
- Review quarterly. Retire events nobody queries; they cost you volume.
If you are also weighing how event data flows between systems, our primer on event streaming analytics covers where to start.
What each costs, and how it scales
Pricing is the part of this comparison that changes fastest, so treat every figure below as a published snapshot and check the live pricing page before deciding.
Both tools charge by event volume past a free tier. Mixpanel moved from monthly tracked users to event-based pricing in February 2026, according to Costbench. Its listing shows a Free plan at 1M events a month and a Growth plan up to 20M events a month, with the first 1M free and then $0.28 per 1K events.
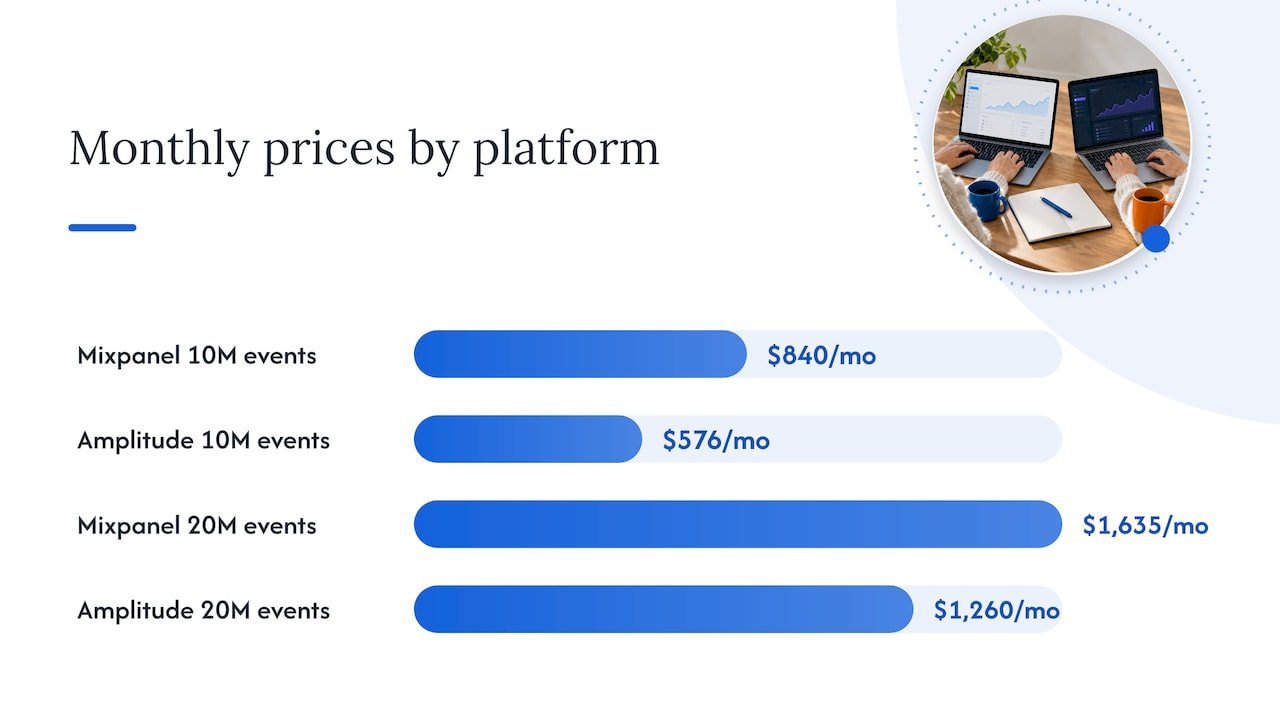
Amplitude’s Free plan covers 2M events a month with unlimited team members, and Plus covers event-based pricing up to 70M events, per a November 2026 reading of its pricing page. Growth and Enterprise are custom quotes.
Userpilot’s October 2026 comparison puts the two side by side at common volumes:
| Monthly events | Mixpanel Growth | Amplitude Plus |
|---|---|---|
| 2M | $185/mo | Free |
| 5M | $438/mo | $225/mo |
| 10M | $840/mo | $576/mo |
| 20M | $1,635/mo | $1,260/mo |
The same Userpilot comparison cites October 2026 procurement data with median annual contract values of $64,000 for Amplitude and $38,978 for Mixpanel. Amplitude contracts ranged from $24,750 to $382,219, and Mixpanel contracts from $13,100 to $122,141.
Two lessons follow. First, list prices at a given volume do not predict the contract you end up with: Amplitude’s enterprise features, governance and analyst time raise the total, and Mixpanel’s simpler setup keeps it lower. Second, event volume is the lever you control. A tidy tracking plan can cut your bill more than any negotiation.
How to decide in five steps
- Name the primary user. If it is a marketer, product manager or growth lead who needs answers without SQL, lean Mixpanel. If it is an analyst or data team that will build and maintain behavioral models, lean Amplitude.
- Decide whether the unit is a user or an account. B2B and account-based teams benefit from Mixpanel’s group-level analysis. Consumer and multi-surface products benefit from Amplitude’s journey view.
- Estimate your monthly events. Multiply active users by the average number of tracked actions per month, and compare the result to each tier. Leave room for growth.
- List the governance you need. Many engineers, many products or regulated data point to Amplitude’s enforcement tooling. A small team with code review can run Lexicon-style documentation.
- Check the downstream connection. Where will the insights go: Salesforce, HubSpot, Power BI, Tableau? The best tool is the one whose data you will actually combine with revenue, and that depends on integration design more than on the product.
If you are still comparing with other tool types, such as web analytics or a warehouse-native approach, apply the same five steps. They hold for any analytics platform.
Where the real return comes from
Teams often buy a product analytics tool hoping it will explain revenue, and then find it explains behaviour. Revenue needs more: campaign cost, CRM stages, deal values, and a model for crediting touchpoints. Our view is that attribution is a map rather than a courtroom verdict. It shows you where value tends to come from, so you can place the next dollar better.
Brainiac Consulting is the AI and digital-transformation division of the MWH Group. We design and operate AI agents and analytics systems for marketing, sales and finance teams, with integrations for Salesforce, HubSpot, Marketo, Power BI and Tableau, and an open-source methodology so you keep full visibility into how each build works. For a team choosing between these two platforms, the relevant services are our AI-enabled analytics and revenue attribution work, and our marketing operations optimization and support, which puts the event data to work inside your marketing stack. If you want agents that act on these insights, see our AI strategy and readiness work.
To talk through your stack and how events should reach your CRM and reports, start at brainiacconsulting.io.
Once your cohorts are in place, our guide to marketing cohort analysis shows how to turn them into channel-level lifetime value.
Our perspective
Choosing between Mixpanel and Amplitude is a real decision, but it is a smaller one than most teams treat it as. Both are capable. Both will tell you what users do.
The decision that shapes your results is what happens after the event is captured. Is the identity rule consistent? Do events reach the CRM as fields a salesperson can use? Does the attribution model reflect how your buyers actually move? We have seen, across marketing and revenue operations work, that the gap is rarely the tool. It is the plumbing and the ownership around it.
That is why we build in the open. When our analytics and agent systems are open-source and integrated with the platforms you already run, you can see how every number is produced, and your team can adjust it. No black box between a metric and the decision it supports.
Our advice: choose the analytics tool that fits your team profile, then design the data flow around it with the same care you gave the purchase. Do that, and either platform can feed reporting, attribution and AI agents that move revenue.
Don
FAQ
Which is better for a small team, Mixpanel or Amplitude?
Mixpanel is usually the easier starting point for a lean team, because its point-and-click reports let non-technical people answer funnel and retention questions without SQL. Amplitude’s free tier is generous at 2M events a month, so it is also worth considering if you expect to add analyst capacity. Start from who will own the analysis.
Is Amplitude cheaper than Mixpanel?
It depends on volume and plan. At published list prices in Userpilot’s October 2026 comparison, Amplitude Plus costs less than Mixpanel Growth at 5M, 10M and 20M events a month. Median enterprise contract values run the other way, at $64,000 for Amplitude against $38,978 for Mixpanel. Confirm current prices on each vendor’s page.
Do both tools support A/B testing?
Yes. Amplitude has a native experimentation module, and Mixpanel now includes Experiments and Feature Flags on every plan, according to Monterail’s 2026 comparison. Limits vary by tier, so check what your plan includes. Amplitude’s module is geared to governed testing at larger scale.
Can either one replace marketing attribution?
They support parts of it. Mixpanel offers nine attribution models for in-product and server-side data, but full-funnel attribution also needs ad spend, CRM stages and deal values. Connecting those sources is what makes the model credible to a CMO and a CFO.
How long does setup take?
Both need technical support to set up and manage event tracking. The time depends mostly on how clearly you define the tracking plan and identity rules before engineers begin, so plan that first.
Sources
- AboutMartech: Mixpanel vs Amplitude
- Growth Analytics Engine: Mixpanel vs Amplitude
- Mixpanel documentation: Revenue Analytics
- Mixpanel documentation: Group Analytics
- Amplitude: How Amplitude Compares
- Userpilot: Mixpanel vs Amplitude comparison
- Monterail: Best Product Analytics Tools in 2026
- Amplitude: session replay comparison
- Amplitude: agent analytics
- TechDogs: Customer Journey Analytics Software
- Fastero: Mixpanel vs Amplitude
- Costbench: Mixpanel pricing
- PulseSignal: Amplitude pricing