

Lead scoring calibration is the work of making your scores mean what sales assumes they mean. A lead scored 80 should convert at a clearly higher rate than a lead scored 40, and that gap should hold up against your closed-won history. To do it, you back-test the current model on past outcomes, check that conversion rises with each score band, then adjust weights and thresholds until the hot list fits what your reps can actually work.
This guide walks through that process in order: the warning signs, the data you need, the back-test, the thresholds, the handling of lower scores, and the review cadence. It is written for marketing, sales and revenue operations leaders who already have a model in place and suspect it has drifted.
TL;DR
- A calibrated model shows monotonic lift: conversion rates climb consistently as score bands rise. If they don’t, the weights need work.
- Warning signs are operational: reps ignoring hot leads, falling back on gut feel, or a quarter or more of inbound volume flagged as hot.
- Back-test using only information that existed on the lead creation date. Anything later leaks the answer into the score.
- Set thresholds from lead volume and sales capacity, and send lower scores to nurture rather than deletion.
- Put recalibration on the calendar and tie it to fresh closed-won data, not to complaints.
Table of Contents
- What calibration means (and what it is not)
- Signs your model is poorly calibrated
- Choose the attributes worth recalibrating
- Set weights from history, not from opinion
- Back-test before you ship any change
- Set thresholds and map them to sales actions
- What to do with lower-scoring leads
- Fold in sales feedback, messy data and shifting buyers
- How often to recalibrate
- A worked example
- Our perspective: calibrate the system, not just the score
- Get help calibrating your scoring
- FAQ
- Sources
What calibration means (and what it is not)
A scoring model has two jobs. It ranks leads (who is more likely to buy than whom) and it triggers action (who gets a call today). Calibration is about whether the numbers line up with reality on both counts.
It is different from building a model. Building decides which signals count. Calibration asks whether the points attached to those signals, and the cut-offs that trigger handoff, still match what customers actually do. A model can have exactly the right signals and still be badly calibrated, because a point value was a guess in the first place, or because buyers changed.
It helps to think of a score as a map rather than a courtroom verdict. A map earns its keep by matching the terrain, and terrain changes: new segments, new channels, a pricing change, a product launch. Calibration is how you redraw the map from what you have since walked.
Signs your model is poorly calibrated
Start with sales behaviour, because reps notice miscalibration before any dashboard does. Rework’s write-up of common scoring pitfalls lists reps complaining that hot leads are not converting as a sign of a threshold problem. The same source points to operational indicators such as hot leads being ignored, reps returning to manual prioritization on gut feel, and more than 25 to 30% of total inbound volume flagged as hot. Treat those figures as a rule of thumb from one vendor, not a standard, but the pattern is familiar: when most leads are “hot”, the label stops meaning anything.
Pair those anecdotes with a few checks you can run in an afternoon:
- Score distribution. Plot the share of leads in each band. A pile-up at the top or a flat middle suggests inflated points or missing decay.
- Conversion by band. For each band, calculate lead-to-opportunity and opportunity-to-won rates. They should rise as the band rises.
- Speed to accept. If sales takes days to accept top-band leads, or rejects many, the handoff criteria and the score disagree.
- Source skew. Check whether one channel (a webinar list, a gated report) fills the top band but rarely closes. Engagement points often reward curiosity, not intent.
- Unscored winners. List recent closed-won deals and look at the scores they carried at creation. Many winners in the low bands means the model is missing what matters.
If two or more of these fail, you have a calibration problem rather than a one-off bad quarter.
Choose the attributes worth recalibrating
Before touching weights, decide which signals deserve a place. Two families do most of the work.
Fit (who they are). Industry, company size, role or seniority, geography, technology in use, and whether the account matches the profile of customers you keep. Fit signals are stable, so they change slowly.
Behaviour (what they do). Pricing page visits, demo or contact requests, repeated product-page sessions, trial activity, replies to sales outreach. Behaviour decays quickly: a demo request from last week is worth far more than one from last spring.
A practical way to review them is to keep fit and behaviour scores separate, calibrate each against closed-won data, and only then combine them. A lead who is a poor fit but very active is a different case from a perfect-fit account that has barely shown up. A single blended number hides that difference.
Three additions are worth considering during recalibration:
- Recency decay. Reduce behavioural points as activity ages, so old clicks stop propping up a score.
- Negative scoring. Subtract points for signals that predict a poor outcome: student or personal email domains, job-seeker patterns, competitors, unsubscribes.
- Enrichment. Missing firmographic fields make fit scoring unreliable. Enriching records before scoring and before routing keeps the model from penalizing leads simply because a field is blank. We cover that sequence in our piece on lead routing automation and enriching before routing.
Set weights from history, not from opinion
Weights are where most models go wrong: someone assigns 10 points to a webinar and 25 to a demo request because it felt right. Calibration replaces feeling with outcomes.
A workable method, whether you run it in a spreadsheet or a notebook:
- Pull a clean set of leads created over a defined window long enough for most to reach an outcome (won, lost or stalled).
- For each signal, compare the conversion rate of leads that had it against those that didn’t.
- Convert those differences into relative weights. A signal that doubles conversion deserves roughly more than one that adds a few percentage points.
- Check for overlap. Pricing-page visits and demo requests often travel together, and counting both can double-count the same intent.
- Re-run the back-test (next section) with the new weights.
Rules-based or predictive?
The calibration approach depends on the model type. Rules-based models assign fixed points. Predictive models, per Keptune’s lead scoring calculator, use logistic regression or gradient-boosted classifiers trained on historical data. In the rules-based case you calibrate by editing points. In the predictive case you retrain, then check that predicted probabilities line up with observed conversion.
The same source suggests logistic regression is a practical choice for most CRM-based scoring with fewer than 20 features and 10,000 leads, while gradient boosting can improve AUC but is harder to explain. Explainability matters for calibration, because reps will only trust (and give feedback on) a score they can interrogate. If you have limited deal history, a transparent rules-based model that you tune is often the better starting point, with predictive scoring layered in once the data supports it. Our guide to making predictive lead scoring actionable covers signals, back-tests and CRM wiring in more depth.
Back-test before you ship any change
Back-testing is the heart of calibration: you ask how the model would have scored leads then, and compare that to what happened next. One practitioner’s back-test method frames the goal as monotonic lift, meaning conversion rates increase consistently as score bands go up.
Here is the sequence:
- Take leads from a past window and score each one using only data available on its creation date.
- Group them into bands (for example deciles or five bands).
- Calculate the conversion rate to qualified opportunity and to closed-won for each band.
- Look for a staircase. Each band should convert better than the one below it.
- Compare top-band results to the average. The ratio is your lift.
- Agree your pass criteria in advance, not after you see the results.
Avoid data leakage
The most damaging mistake is leakage. The same source stresses that a back-test must use only information from the lead creation date, not events that occurred later in the sales cycle. If your scoring fields include things like “meeting booked” or “proposal sent”, you are scoring with the answer. The model will look brilliant in testing and fail in production.
Watch for leakage in fields that get overwritten. A job title updated after a sales call, or a lifecycle stage changed on conversion, reflects the future. If your CRM does not keep field history, snapshot the scoring inputs going forward so next quarter’s back-test is clean.
Which metrics to track
| Metric | What it tells you | Healthy sign |
|---|---|---|
| Conversion by score band | Whether ranking works | Rates rise with each band |
| Lift of top band vs. average | How much the score concentrates winners | Clear, stable multiple |
| Share of leads flagged hot | Whether the threshold is too loose | Fits sales capacity |
| Recall of closed-won deals | How many eventual winners the hot list catches | High enough that winners aren’t hiding below threshold |
| Precision of hot list | How many hot leads become opportunities | Reps agree the list is worth calling |
| Speed to first touch | Whether sales acts on the score | Falls for top bands |
Precision and recall pull against each other. Tighten the threshold and your list gets cleaner but misses winners; loosen it and you catch more but waste calls. Keptune notes that a threshold recommendation can optimize that trade-off for a given sales capacity, which is the right framing: the best threshold is the one your team can work properly.
Set thresholds and map them to sales actions
A score without an action is a number on a record. Calibration finishes when each range triggers something specific.
Start from capacity. If your team can work 60 new leads a week, a threshold that produces 300 hot leads is miscalibrated regardless of how accurate the ranking is. The back-test post recommends choosing thresholds to fit lead volumes, with pass criteria set in advance.
A simple three-tier map works for many teams:
- Top band: routed to a rep for same-day follow-up, with enriched context attached.
- Middle band: short nurture sequence plus a trigger to move up on specific behaviours such as a pricing visit.
- Lower band: low-touch nurture and periodic re-scoring.
Routing rules depend on clean data. Duplicate records split activity across contacts and produce scores that undercount real engagement, which is why CRM deduplication belongs on the checklist before you tune weights. If you plan to sync model output from a warehouse, our note on reverse ETL for CRM explains how scores reach reps’ views quickly.
What to do with lower-scoring leads
A low score is a statement about priority, not worth. Fairview’s glossary makes the point that treating a score as grounds for disqualification instead of prioritization is a major mistake, and that lower scores belong in low-touch nurture rather than deletion. We agree. Buyers arrive late, change roles, and respond to timing, so a lead who looks cold in March may be warm by autumn.
In practice that means a lighter cadence: educational content, periodic check-ins, and re-scoring when behaviour changes. Our guide to building an effective lead nurture strategy lays out the sequence. For leads that need a quick read on whether the buyer has budget and authority, a tool for qualifying who can buy before the call can help you decide whether a lead earns sales time.
Setting a clear exit path matters too. Define what moves a lead up (a pricing visit, a second stakeholder joining, a reply) so the lower band is a waiting room with a door, not a dead end.
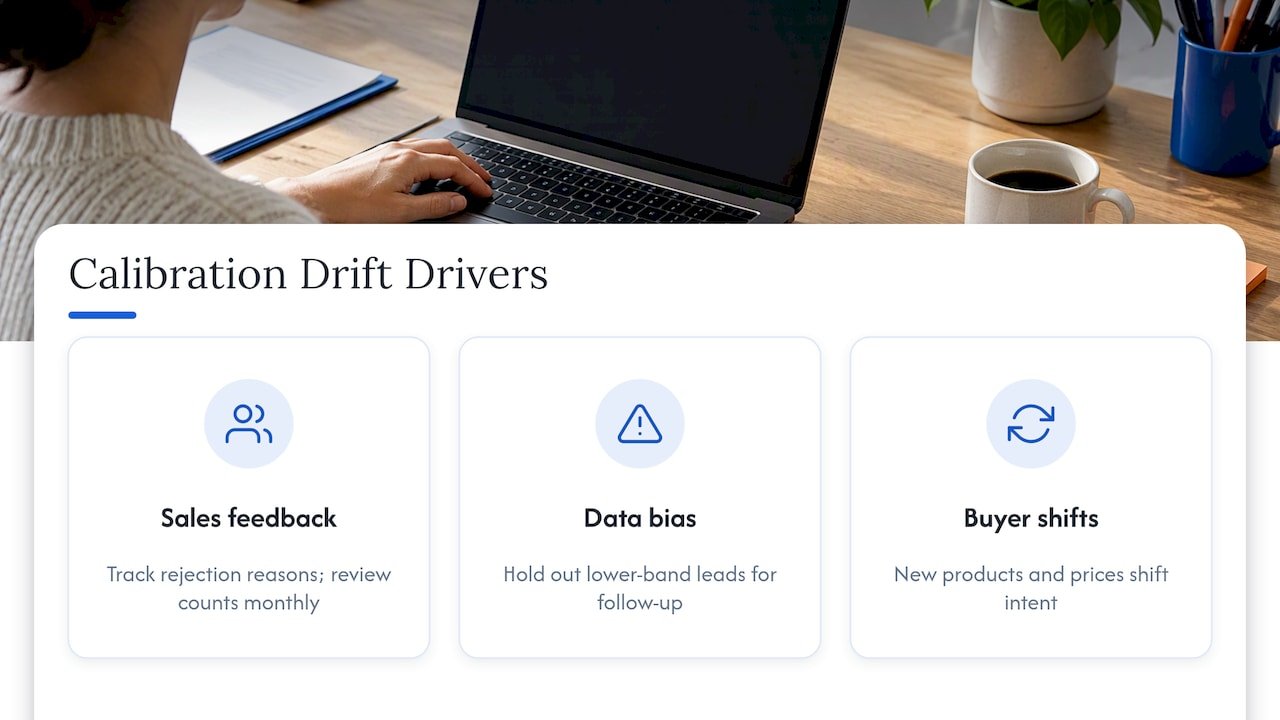
Fold in sales feedback, messy data and shifting buyers
Three forces erode calibration over time, and each needs a deliberate response.
Sales feedback. Reps see what the data cannot: a lead scored high who was clearly a student, or a low scorer who closed after a referral. Capture this in a structured field on rejection (wrong fit, no budget, no response, already a customer) rather than in free-text notes. Review the counts monthly. A recurring rejection reason points to a specific scoring rule to fix. Treat feedback as a signal to test against data, not a command; a single loud rep is an anecdote.
Biased or incomplete data. Your history reflects who you chose to call. If sales ignored a segment, that segment looks like it never converts, and the model learns to ignore it too. Check whether low-band leads were ever worked. If they weren’t, their poor results are untested rather than proven. A small holdout, where a sample of lower-band leads receives normal follow-up, shows what you are missing. Missing fields cause a related bias, so measure completeness by source.
Changing customer behaviour. New product lines, price changes, channel mix and economic conditions all move what intent looks like. A model trained on last year’s buyers can quietly stop matching this year’s. That is why calibration needs a schedule rather than a trigger.
How often to recalibrate
There is no universal interval. Practitioner guidance clusters around reviewing quarterly or twice a year, and the right pace depends on volume and how fast your market moves. Our recommendation is a layered rhythm:
- Monthly: glance at score distribution, share flagged hot, and rejection reasons. Cheap, and it catches drift early.
- Quarterly: run the full back-test against the latest closed-won and closed-lost data, and adjust weights and thresholds.
- After a major change: a new product, pricing, segment, CRM migration or form redesign should trigger an off-cycle review.
- Annually: revisit the model’s structure, including whether to move from rules-based to predictive scoring.
If your sales cycle runs six months, a quarterly back-test will see few completed outcomes from recent leads, so use qualified-opportunity creation as the primary outcome and closed-won as the lagging confirmation.
Record every change in a short log: date, what changed, why, and the before and after back-test numbers. Without it, nobody can tell next year whether a dip came from the market or from your edits.
A worked example
Imagine a services firm whose model awards 30 points for any content download and 20 for a director title. Back-testing the last 12 months shows the top band converts to opportunity barely better than the middle band. Digging in, downloads dominate the top band, many from researchers outside the target segment.
The fix is a calibration pass rather than a rebuild: cut the download weight, add negative scoring for non-target domains, give pricing visits and reply events more weight, and decay behavioural points after 30 days. The team re-runs the back-test on creation-date data only and checks that conversion climbs band by band. It then sets the hot threshold so about one in ten new leads qualifies, matching rep capacity. This example is illustrative, not a client result, but it shows how small, evidence-led edits change what a score means.
Our perspective: calibrate the system, not just the score
Most calibration advice stops at the weights. In our work, the larger gains tend to come from the plumbing around them: whether enrichment runs before scoring, whether duplicates are merged, whether the score lands in the CRM where reps work, and whether anyone owns the review cycle.
We build and operate AI agents and analytics systems for marketing, sales and finance teams, and we favour open-source, visible builds so you can inspect why a lead scored the way it did. A score that can be explained gets challenged by sales, and that challenge is what keeps a model honest. We would rather you trust a modest model you understand than a black box you can’t question.
The pattern we encourage is to start with one use case, prove it with a back-test, then extend. An agent can enrich a record, propose a score, flag drift against the last quarter’s closed-won data, and queue the recalibration for a human to approve. People set the pass criteria and make the call. That keeps accountability where it belongs, while removing the manual data pulls that make teams skip reviews.
— Don
Get help calibrating your scoring
If your hot list is bloated, your reps have stopped trusting scores, or you can’t back-test because the data isn’t clean, we can help. Brainiac Consulting designs and runs lead enrichment, intent prediction, CRM automation and attribution systems that integrate with Salesforce, HubSpot, Marketo, Power BI and Tableau. Start with an AI readiness assessment and roadmap, or talk to us about custom agent deployment for scoring and routing.
For an overview of everything we offer, see the Brainiac Consulting home page.
FAQ
What is lead scoring calibration?
It is the process of testing and adjusting a model’s point values and thresholds so scores match actual conversion outcomes. You compare score bands against qualified-lead and closed-won results, then tune until higher scores reliably convert better.
How do I know if my lead scores are accurate?
Back-test the model on past leads using only data available when each lead was created, then check that conversion rises with each band. Also watch behaviour: reps ignoring hot leads, or a large share of inbound flagged hot, signals a problem.
How often should I recalibrate a lead scoring model?
A light monthly check on distribution and rejection reasons, plus a full back-test each quarter, suits most teams. Run an off-cycle review after a pricing, product, segment or CRM change.
Should low-scoring leads be discarded?
No. A low score means lower priority, not no value. Send those leads to low-touch nurture and re-score them when their behaviour changes.
Sources
- Common AI Lead Scoring Pitfalls (And How to Fix Them)
- Lead Scoring Model Calculator
- Validate a Lead Scoring Model With a Back-Test
- Predictive Lead Scoring: Definition