

Churn prediction in ecommerce means estimating which customers are drifting away before they are gone, then acting while a nudge can still change the outcome. The hard part is rarely the algorithm. It is defining churn for a store where nobody cancels anything, choosing signals you can trust, and connecting the score to an action your team will actually take.
This guide walks through that sequence: what churn means when there is no cancellation button, which behaviours warn you early, how the main model families work, how to use scores without wasting discounts, and how B2B churn differs. We also cover the guardrails that keep an AI-driven retention programme fair.
TL;DR
- In a store without subscriptions, churn is inferred: a customer has not reordered within a window based on your category’s normal repurchase rhythm.
- The strongest early signals are slower reorders, smaller baskets, fading email engagement, unresolved support issues and payment failures.
- Start simple (RFM segments, then a probabilistic repurchase model) before reaching for deep learning. Ensemble methods still dominate in practice.
- A risk score only pays off when it triggers a specific action, and when you test whether that action really changes behaviour.
- Govern the model: check for bias in who receives offers, and watch for drift as your customer mix changes.
Table of Contents
- What churn means when nobody cancels
- The signals that warn you early
- How churn prediction models work
- From risk score to retention action
- How B2B churn prediction differs
- Using AI on customers responsibly
- Our perspective: prediction is a decision tool
- Where Brainiac can help
- FAQ
- Sources
What churn means when nobody cancels
Churn rate is the percentage of customers who stop doing business with you over a given period. For subscription products, that is easy to observe, because a cancellation or opt-out of a recurring payment marks the exit. For regular ecommerce, the same source describes cohort churn as the share of customers who do not reorder within twice the average repeat-purchase timeline.
That definition matters more than it looks. A pet food store with a 30-day reorder cycle and a furniture retailer with a three-year cycle cannot share a churn window. If you borrow a generic 90-day cutoff, you will label loyal sofa buyers as lost and miss real defection among coffee subscribers.
A practical way to set your window:
- Take customers with at least two orders and measure the gap between their orders.
- Find the typical gap for each product category, not just for the store as a whole.
- Set the churn window at roughly twice that typical gap, as the cohort definition above suggests.
- Revisit it each quarter, since promotions and seasonality stretch or compress gaps.
Think of the window as a map rather than a courtroom verdict. It tells you where customers are likely to be, not a final judgment on any one of them. Some “churned” customers will come back, and that is exactly why prediction beats a simple lapsed-customer list.
Why first-time buyers dominate the problem
One Swedish retail study found that churn exceeded 75% among customers with one previous purchase, while it was around 25% for those with at least four. The study is one retailer’s data, so do not treat the figures as a benchmark for your store. The pattern is the useful part: the gap between the first and second order is where most of your risk concentrates, and a second purchase changes a customer’s profile sharply.
That suggests a priority. If your model has to be good at one thing, make it good at the first-to-second order transition. Our piece on customer lifetime value modeling covers how repurchase probability and value estimates fit together.
The signals that warn you early
A churn model is only as good as the behaviours feeding it. Stripe’s guide on building churn models lists decreased order frequency or size, declining engagement with marketing messages, unresolved support issues, negative feedback, and billing or payment problems as indicators. Translated into features you can compute in a store:
| Signal | How to build it | What it tells you |
|---|---|---|
| Recency | Days since last order, relative to the customer’s own typical gap | Overdue for a reorder |
| Frequency trend | Orders in the last 90 days versus the prior 90 | Slowing habit |
| Basket trend | Average order value, recent versus historical | Shrinking commitment |
| Email engagement | Open and click rates over rolling windows | Fading attention |
| Site activity | Sessions and product views per week | Dropping interest |
| Support history | Open tickets, reopened tickets, refund requests | Unresolved friction |
| Payment issues | Failed charges, expired cards | Involuntary loss |
Two cautions. First, compare each customer against their own baseline as well as the store average, because a monthly buyer who goes quiet for six weeks is a stronger signal than a twice-yearly buyer doing the same. Second, support data is often the most underused input. A customer whose delivery problem sat unanswered is at higher risk than one who never contacted you, and support email metrics such as response and resolution times are worth joining to your order data so the model can see them.
If your signals live in different tools, the first project is usually plumbing, not modeling. A clean customer table that joins orders, email, support and web events does more for accuracy than any algorithm swap.
How churn prediction models work
There are three broad families, and most stores should climb them in order.
Rules and segments: RFM
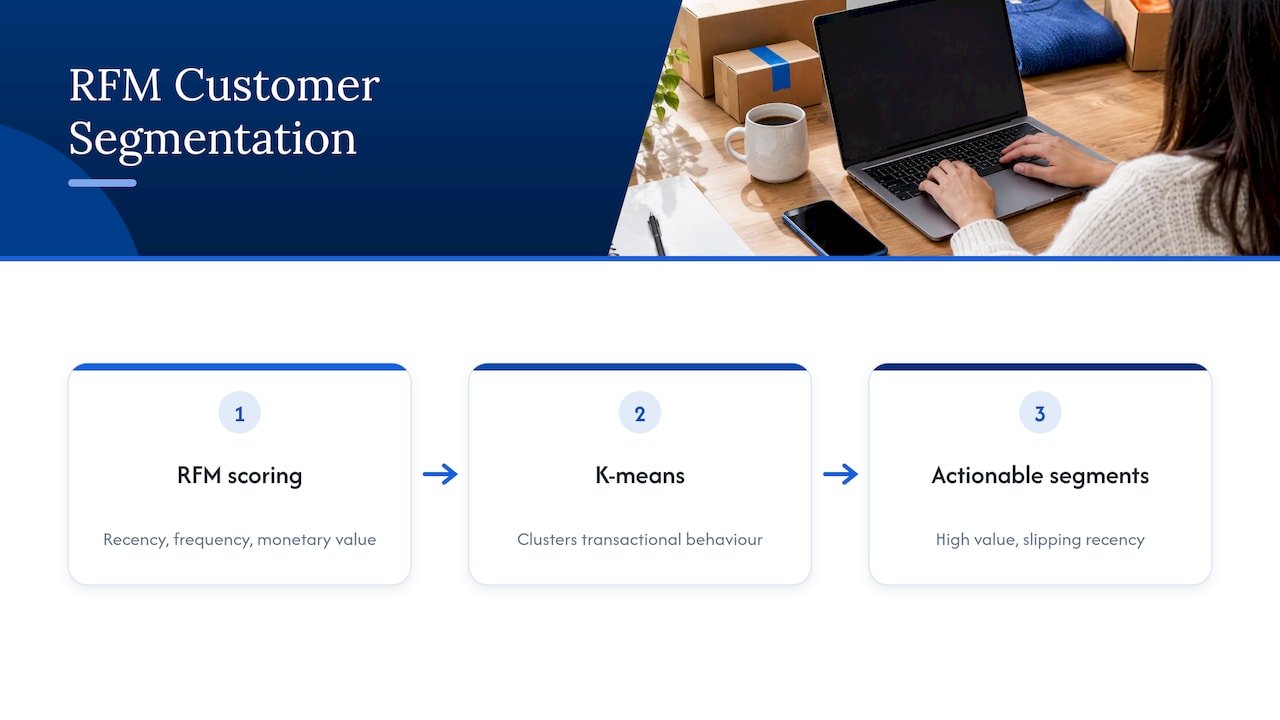
Recency, frequency and monetary value (RFM) scoring ranks customers on how recently, how often and how much they buy. One recent study combined RFM analysis with K-means clustering to segment online retail customers by transactional behaviour before predicting churn. Segments like “high value, slipping recency” are immediately actionable and need no data science team.
Probabilistic repurchase models
Stores with non-contractual customers face a real problem: you never see the moment someone leaves. Shopify’s engineering team describes BG/NBD as a probabilistic model that estimates whether each customer is still active, instead of forcing a binary active or inactive label with an arbitrary cutoff. The output is a probability, which is far more useful than a flag. It also pairs naturally with lifetime value work, which is why we start there in our BTYD-first approach.
Supervised machine learning
Here you train a classifier on historical customers labelled as churned or retained, using the features above. A systematic review of recent churn research finds that deep-learning approaches such as LSTMs and CNNs are increasingly applied to complex data, while ensemble methods remain dominant in machine learning generally. For most stores with tens of thousands of customers, gradient-boosted trees on well-built features will do the job. Deep sequence models earn their keep when you have rich clickstream data and the engineering capacity to maintain them.
How to judge a model
Accuracy alone misleads, because churners are often a minority and a model that predicts “nobody churns” can look accurate. Look at how well the model ranks risk, how many of your top-decile customers really lapse, and how it performs on a time-based holdout (train on the past, test on the following months). Our guide on evaluating whether an AI analytics platform is accurate enough goes through backtesting in more detail, and the same discipline applies to a lead scoring model, as we explain in making predictive lead scoring actionable.
From risk score to retention action
A score sitting in a dashboard retains nobody. The Shopify engineering write-up suggests ranking customers by their probability of being active and targeting those around 50% with campaigns, discount codes, prioritized fulfillment or customer support. The logic is sound: customers at 95% will probably buy anyway, and those near zero rarely respond, so the persuadable middle is where effort pays.
A simple playbook by risk band:
- Low risk, high value: protect the experience. Fast shipping, early access, no discounts.
- Middle risk, high value: personal outreach, a replenishment reminder timed to their usual gap, or a service check-in.
- Middle risk, lower value: an automated email sequence. Hold discounts back unless a test shows they lift reorders.
- High risk, high value: a human follow-up, especially if a support issue is open.
- Payment failures: fix them first with retry logic and card-update prompts. This is churn you can prevent without any prediction.
Test whether the action works
A model tells you who is likely to leave, not who will respond to your offer. Some at-risk customers would have returned anyway, and discounting them just burns margin. Holdout groups settle the question: keep a random slice of at-risk customers untouched and compare reorder rates. The same logic underlies always-on incrementality testing, and cohort views like those in our marketing cohort analysis guide show whether retained customers keep buying after the offer ends.
Close the loop in your CRM
Scores should flow to where campaigns run: your email platform, helpdesk and CRM. Automation without limits can misfire, for example sending a win-back discount to someone mid-refund dispute. Our notes on CRM automation workflows and the guardrails revenue teams need cover suppression rules and approval steps for exactly this.
How B2B churn prediction differs
If you sell to businesses, whether wholesale through a store or software to companies, the picture shifts. Accounts are fewer, contracts or purchase orders are larger, and one departure matters more.
An academic study of non-contractual B2B settings found that churn models can rely exclusively on invoice-level data, that longer histories tended to improve some classifiers, and that multi-slicing the data produced better-performing models than single-slicing. In plain terms: invoices alone can carry you a long way, and giving the model several time views of the account helps.
For SaaS businesses, a 2024 master’s thesis on a B2B software company identified contracted monthly recurring revenue trends and the diversity of booking types and account categories as key predictors. The same thesis notes that B2B churn is less explored than B2C and uses feature aggregation to account for end-customer history.
Practical differences to plan for:
- Fewer data points. With hundreds of accounts instead of hundreds of thousands of shoppers, simple models and strong features beat complex ones.
- Account-level signals. Seat usage, number of active buyers, ordering diversity and executive contact matter more than clicks.
- Human action. The response is usually an account manager’s call, so the output should be a prioritized list with reasons, not a score alone.
- Pipeline link. Churn risk feeds forecasting, which is why it sits alongside the sales pipeline analytics view for revenue leaders.
Using AI on customers responsibly
AI can predict churn, but it can also quietly encode unfairness. If the model learns that customers from certain postal codes or on certain devices rarely respond, retention offers may flow to some groups and bypass others. Check who receives interventions by segment, and judge the model on fairness as well as lift, not only overall accuracy.
Four habits keep a programme honest:
- Document what data goes in and drop features that act as stand-ins for protected characteristics.
- Compare offer rates and outcomes across customer groups at every model release.
- Monitor drift: a new product line, a holiday season or a pricing change can break patterns the model learned.
- Respect privacy law where you operate. California shoppers, for instance, have rights that touch how behavioural data is used, and our CCPA checklist for marketers maps those data flows. For your own legal exposure, ask your counsel.
We lay out a fuller structure for ownership, approvals and monitoring in our AI agent governance implementation framework.
Our perspective: prediction is a decision tool
We see the same pattern when stores come to us wanting churn prediction. They have a model, or a vendor’s score, and no change in retention. The cause is almost never the math. It is that the score never reached a decision: nobody owned the action, nobody tested it, and the data feeding it was stitched together by hand.
Our view is that a churn programme has three layers, and you should build them in this order:
- Trusted data. One customer view across orders, marketing, support and payments, with definitions everyone agrees on.
- Transparent models. We build in the open and inside your environment, so your team can see features, assumptions and failure modes. A black-box score that nobody can explain is hard to defend when finance asks why you discounted a segment.
- Agents that act within limits. Once scores are reliable, an AI agent can draft the win-back email, open the support task or flag the account manager, with approvals where the stakes are high.
Start with one pilot, one segment and one measurable action, then widen. That is the same logic we apply in our experiment-first ecommerce attribution work: the model earns trust by proving itself against a holdout, not by sounding sophisticated.
— Don
Where Brainiac can help
If you want churn prediction wired into your stack rather than left as a notebook, we design and run it. That can start with an AI readiness assessment and roadmap to find the retention use case with the clearest payback, then move to custom agent deployment that scores customers and triggers actions in your CRM and email tools. Not sure whether to build or have us operate it? Our comparison of managed AI agents versus a custom build lays out the trade-offs. You can also start from our main site and tell us where your reorder data lives.
FAQ
Can AI predict churn?
Yes, with limits. Models trained on order history, engagement and support data can rank customers by how likely they are to lapse, and ensemble methods remain the common choice. They predict likelihood, not certainty, and they need regular monitoring for drift and bias. The real test is whether the customers you act on reorder more than a similar untouched group.
What is a good churn rate for an ecommerce store?
There is no universal number, because churn depends on your reorder cycle and on how you define a lapsed customer. A store with a short replenishment cycle will see different rates than one selling durable goods. Measure your own cohort churn using a window based on your category’s repurchase gap, then track whether it improves quarter to quarter.
How much data do I need to start?
Enough repeat purchasers that a pattern can show up. If you have only a few hundred repeat customers, start with RFM segments and a probabilistic repurchase model, which need little more than order dates and values. Move to supervised machine learning once you have a few thousand customers with observable outcomes and several months of history.
How is B2B churn prediction different?
B2B has fewer customers, larger accounts and signals such as invoice patterns, recurring revenue trends and the variety of what an account buys. Research on B2B models shows invoice-level data can be enough, and that giving the model several time slices improves results. The output usually goes to an account manager, so explanations matter as much as scores.
Sources
- Churn Rate in Ecommerce: Calculate and Reduce It, Shopify
- Predicting Customer Churn in Retailing, DiVA
- How to Build a Customer Churn Model, Stripe
- Six Support Email Metrics to Spot Churn Early, SendSync
- Enhancing customer retention in online retail through churn prediction, ACM
- How Shopify Merchants can Measure Retention, Shopify Engineering
- Customer Churn Prediction: A Systematic Review of Recent Advances, MDPI
- Customer Churn Prediction in B2B Non-Contractual Business Settings, MDPI
- Predicting Customer Churn at a SaaS B2B Company, KTH