Win loss analysis is the practice of finding out why you win and lose deals by going to the people who decided: your buyers. You combine what your CRM records with what buyers tell you in interviews or surveys, group the reasons into themes, and use the patterns to change how you sell, position and build. Done once, it is a post-mortem. Done on a schedule, it becomes a win-loss program that keeps your revenue team honest about the market.
This guide covers how to scope a program, who to talk to, how to read a win-loss ratio (including what a 2.0 means), how AI fits in, and how to make sure findings reach the workflows where revenue is actually made.
TL;DR
- Win loss analysis pairs buyer feedback with CRM data to explain deal outcomes, rather than relying on the rep’s account or a dropdown reason.
- A program looks at cohorts of deals for recurring patterns. A single deal debrief only explains one deal.
- A win-loss ratio of 2.0 means two wins for every loss, which is a win rate of about 67% when only wins and losses are counted.
- Include no-decision outcomes, use a neutral interviewer, and keep the cadence steady instead of running one big study.
- Findings only pay off when they change qualification rules, messaging, routing and forecasts. Plan those owners before the first interview.
Table of Contents
- What win loss analysis actually is
- Why teams run a win-loss program
- Setting up a win-loss program
- Collecting buyer feedback
- Analyzing and reporting the reasons
- How to read a win-loss ratio
- Where AI helps, and how to use it well
- Turning findings into changes
- Our perspective
- Put win-loss findings to work with Brainiac
- Common mistakes to avoid
- FAQ
- Sources
What win loss analysis actually is
Most teams already have a view on why deals close or stall. It lives in CRM fields such as “Closed Lost: Price” and in the stories reps tell at the end of the quarter. Win loss analysis replaces that view with evidence collected from the buyer’s side of the table.
In practice that means three inputs working together:
- Deal data from your CRM: deal size, stage reached, segment, source, competitor, product, rep and dates.
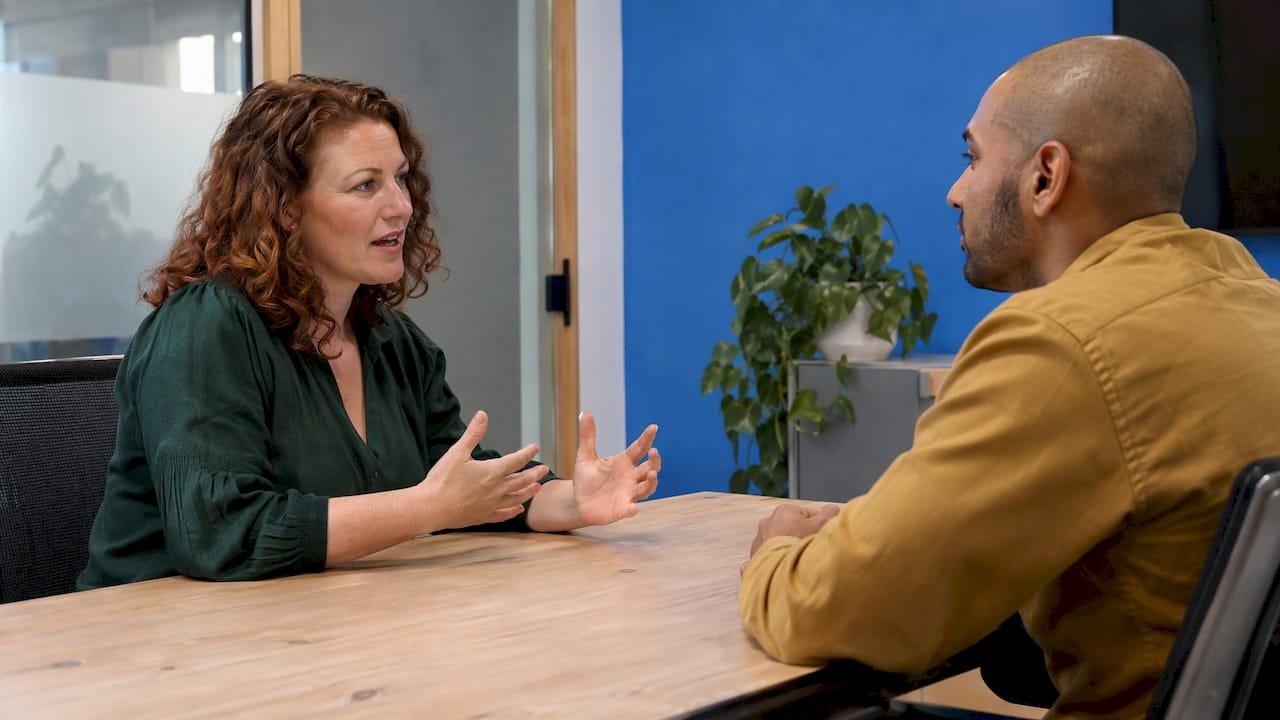
- Buyer feedback from interviews or surveys, covering how they evaluated options, who was involved and what tipped the decision.
- Interpretation: tagging responses against a consistent set of categories so themes can be counted, compared and tracked over time.
The value lies in the gap between the internal story and the buyer’s story. A rep may report a loss on price while the buyer explains that they never understood the implementation timeline. Those are two different problems with two different owners. Pragmatic Institute makes a similar point: a structured process helps companies avoid relying on anecdotal knowledge and understand their buyers better.
Win-loss program versus deal debrief
The two are often confused, and both are useful.
| Deal debrief | Win-loss program | |
|---|---|---|
| Unit of analysis | One opportunity | A cohort of opportunities |
| Main question | What happened here? | Why do outcomes repeat across segments? |
| Who runs it | Sales manager or deal team | Revenue operations, product marketing or an outside team |
| Source of truth | Rep’s recollection, call notes | Buyer interviews plus CRM data |
| Output | Coaching for one deal | Changes to positioning, qualification, product and process |
Keep debriefs. Just do not mistake them for a program. A debrief tells you about a deal. A program tells you about your go-to-market motion.
Why teams run a win-loss program
Different teams pull different value from the same dataset.
- Sales learns where deals are actually decided, which objections are real and which are reflexive, and where discovery calls go thin.
- Marketing finds out which claims buyers believe, which they ignore, and which competitors they really compare you with, which is often not the list on your battlecard.
- Product hears unprompted what was missing, what was confusing and what was over-built.
- Revenue operations and finance get a reality check on forecast assumptions, stage definitions and lead quality.
- Executives get a clearer read on competitive position than a dashboard can provide.
There is also a link to growth more broadly. Listening to customers systematically is a recurring theme in revenue strategy, and this overview of customer feedback and revenue growth shows how feedback loops feed commercial decisions. Win-loss is the most targeted version of that loop, because it asks people at the exact moment they chose.
Setting up a win-loss program
Think of the setup as drawing a map before you walk the territory. Five decisions shape everything that follows.
1. Define the learning objectives
Start with questions, not a template. Examples:
- Why are we losing mid-market deals to a specific type of competitor?
- Why do qualified opportunities stall in the evaluation stage?
- Which of our claims do winning buyers repeat back to us?
- Are we losing to alternatives, or to doing nothing?
Two or three objectives is plenty. Objectives decide which deals you sample and which questions you ask.
2. Pull in stakeholders early
Invite sales leadership, product marketing, product, customer success and revenue operations before the first call. People act on findings they helped frame. Agree on who owns each kind of finding: messaging goes to marketing, discovery gaps to sales enablement, missing capabilities to product, stage and routing issues to RevOps.
3. Scope the deals
You cannot interview everyone, so choose deliberately. Useful filters are deal type, value band, date range, competitor and vertical. Prioritize opportunities that went far down the pipeline, such as final-two situations, because those buyers have compared you seriously and have the most to say. Keep the mix balanced: wins, losses and no-decisions. Interviewing only losses teaches you what to fix but not what to protect.
4. Treat no-decision as its own outcome
When a buyer chooses to do nothing, the CRM usually files it as lost or stalled and moves on. These deals often reveal weak urgency, unclear business cases or messaging that failed to frame the cost of inaction. If your pipeline has many of them, they deserve a place in the sample.
5. Set a cadence you can sustain
A small, steady batch of interviews every quarter beats one large study that nobody repeats. Patterns settle once you have heard from enough buyers in a defined segment, and a regular rhythm lets you see whether changes you made are moving outcomes. Put the review on the calendar before you start recruiting, and decide who presents it.
Collecting buyer feedback
Interviews and surveys
Interviews give depth. Surveys give reach. Many programs use interviews for the highest-value or most strategic deals and short surveys for the long tail.
A few practices make interviews honest:
- Use a neutral interviewer. Buyers soften their answers for the person who sold to them. A colleague from outside the deal team, or an external party, gets more candour.
- Talk soon after the decision. Memories fade quickly. Aim to speak with the buyer within weeks, not quarters.
- Interview the decision-maker, not only your champion. A champion tells you what they thought. The economic buyer tells you what carried the decision.
- Ask about the process first. How did they start looking, who was involved, what alternatives did they consider, and only then why they chose as they did.
- Keep your questions open. “Walk me through how you narrowed the list” outperforms “Was price a factor?”
Sample questions that surface real reasons
- What was happening in the business when you decided to look for a solution?
- Who else was involved, and what did each person care about?
- Which options did you consider, and how did you compare them?
- What was the moment you felt sure about your decision?
- What did we do well, and where did we leave you with questions?
- If you could change one thing about our process, what would it be?
Build the data spine in your CRM
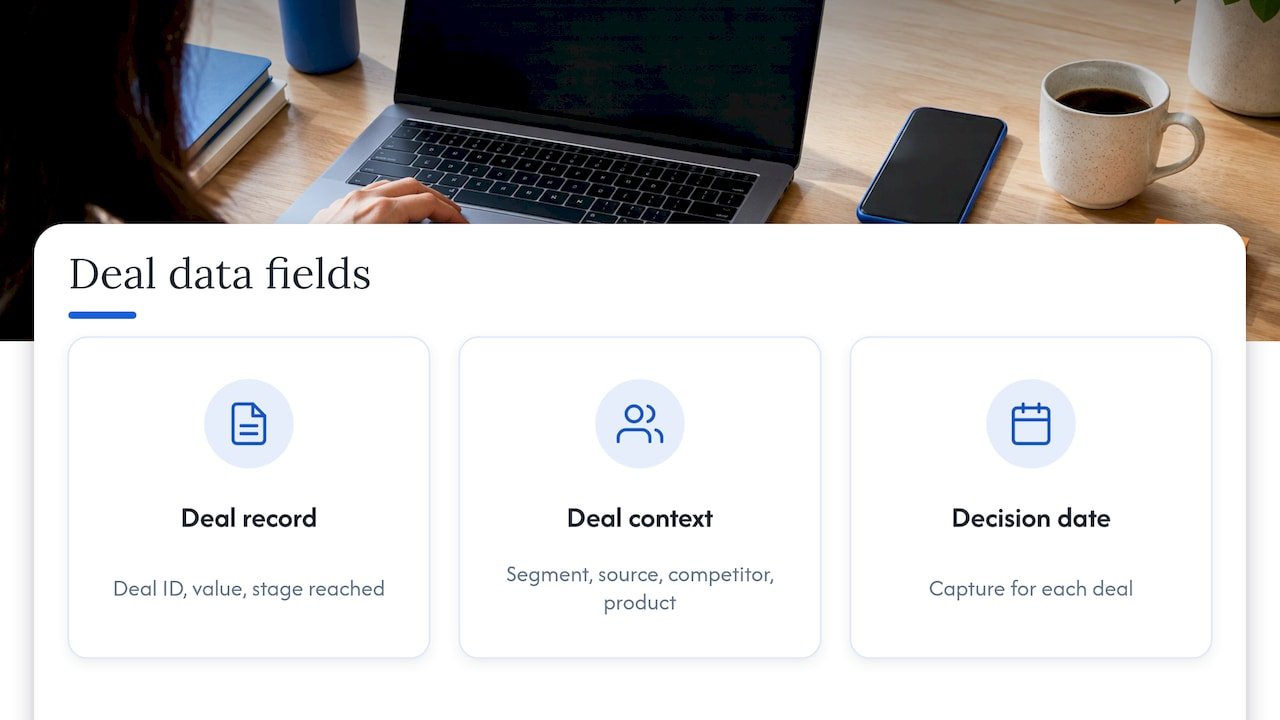
Interview notes are only as useful as the deal data they attach to. For each deal, capture a consistent set of fields: deal ID, value, stage reached, segment, source, competitor, product and decision date. This is where data hygiene shows up as a win-loss issue. If duplicate accounts split one buyer’s history across several records, your cohorts will be wrong before you analyze anything. Our guide to CRM deduplication without orphaned deals explains how to clean this up safely, and AI lead enrichment for B2B GTM teams covers filling firmographic gaps so segmentation holds up.
Analyzing and reporting the reasons
Once interviews are done, the work is coding. Create a short list of categories before you read the transcripts, for example product fit, pricing and packaging, implementation concerns, brand trust, sales experience, competitive alternative and timing. Tag each response against them, and allow a few emergent tags for surprises.
Then build the report around decisions, not data:
- Headline pattern: the two or three themes that explain the most outcomes this quarter.
- Segment cuts: how reasons differ by deal size, industry, source or competitor.
- Verbatim evidence: short buyer quotes, anonymized, next to each theme.
- Recommended actions: each with an owner and a date.
- Last quarter’s actions: what changed and whether outcomes moved.
Searchable, structured findings matter. A quarterly deck that nobody can query six months later is a lost asset. Store coded responses in a shared system tied to account and opportunity IDs.
How to read a win-loss ratio
Two numbers are easy to confuse, and the difference matters when you present results.
- Win-loss ratio is wins divided by losses. According to the Competitive Intelligence Alliance, you calculate it by dividing the number of wins by the number of losses.
- Win rate is wins divided by total opportunities. The same source notes that win rate accounts for the full pipeline, including deals that stalled or went dark.
What a 2.0 means
A win-loss ratio of 2.0 means you win two deals for every one you lose. If those are the only outcomes, you have won two out of three, a win rate of about 67%. A ratio of 1.0 means wins and losses are equal, a 50% win rate. A ratio below 1.0 means you lose more than you win.
Worked example
Suppose a quarter ends with 24 wins, 16 losses and 20 no-decisions.
- Win-loss ratio: 24 / 16 = 1.5
- Win rate on all 60 opportunities: 24 / 60 = 40%
- Win rate excluding no-decisions: 24 / 40 = 60%
The same quarter looks healthy or unhealthy depending on the measure. The ratio flatters you because it ignores the 20 deals that went nowhere. That is why we recommend reporting both, and always saying how you treated no-decisions.
Reading the number honestly
- A ratio is a symptom, not a diagnosis. It tells you how often you win, never why. That is the job of the interviews.
- Segment it. A blended 1.5 can hide a 3.0 in one segment and a 0.6 in another.
- Watch sample size. A ratio from a handful of deals swings wildly.
- Be consistent. Define what counts as an opportunity (qualified stage, minimum deal value) and keep it fixed so trends mean something.
For the pipeline view that sits beside the ratio, see our B2B funnel analysis and sales pipeline analytics playbook.
Where AI helps, and how to use it well
AI is useful at the heavy, repetitive parts of a program: transcribing and summarizing interviews, tagging responses against your categories, spotting recurring phrases across hundreds of call recordings, and flagging at-risk deals in the open pipeline that look like past losses.
A practitioner view worth keeping in mind: the quality of AI-generated insight is proportional to the richness of the input, and call transcripts are among the highest-leverage inputs for a scalable program. Thin CRM dropdowns produce thin conclusions, however capable the model.
Practical guardrails:
- Feed it good data. Pair transcripts with clean opportunity records so the model can compare cohorts.
- Keep a human in the loop for category design and for reviewing the themes before they reach leadership.
- Handle personal data deliberately. Interview recordings and CRM records can contain personal information. Agree on consent, retention and access rules with your legal and security teams, and for California contacts, see our CCPA checklist for marketers.
- Keep it inspectable. Teams should be able to trace any theme back to the underlying quotes.
That last point is why we favour open, observable builds. If you cannot see how a conclusion was reached, you cannot defend it in the boardroom. Our approach to governed agent deployment with shadow validation is designed around that principle.
Turning findings into changes
Insight that does not change a workflow is trivia. Map each theme to the system it should alter.
| Finding | Workflow to change | Example action |
|---|---|---|
| Buyers say we were a poor fit for their size | Qualification and lead scoring | Re-tune scoring using closed outcomes, see lead scoring calibration |
| Wins cluster in one vertical | Segmentation and targeting | Revisit ideal customer profile, see B2B segmentation models |
| Buyers could not explain our value to their boss | Messaging and sales content | Rewrite the business case narrative and enablement material |
| Strong leads reached the wrong rep late | Routing | Enrich before routing, see lead routing automation |
| Many no-decisions after demo | Discovery and stage definitions | Add urgency and cost-of-inaction questions at qualification |
| Buyers researched us in AI assistants first | Content and search visibility | Establish a baseline, see our AI visibility benchmark |
| Different reps give different reasons for the same outcome | Attribution and buyer journey data | Fix account identity, see buyer journey analytics |
Two habits keep this honest. First, give every action one owner and one date. Second, open the next quarter’s review with what changed, so the program is judged by outcomes and not by the number of slides.
Our perspective
Most of the win-loss programs we see stall for a plain reason: the insight lives in one team’s slide deck and the systems that run revenue never hear about it.
We think of attribution as a map rather than a courtroom verdict, and win-loss belongs on that map. Interviews tell you why a buyer turned left. Your CRM, your analytics and your routing rules decide whether the next buyer is sent the same way. Both halves have to be connected.
That is how we approach it at Brainiac. We design and operate AI agents and analytics systems for marketing, sales and finance teams, and we build them in the open so you can see how every output was produced. Lead enrichment keeps your cohorts clean. Intent prediction and pipeline hygiene point you to the deals worth interviewing. Attribution and forecasting models turn the themes into numbers a CMO and a CFO can both read. We integrate with the platforms you already run, including Salesforce and HubSpot.
Our advice is to start narrow: one segment, one question, one quarter. Prove that the findings move a metric, then widen the lens.
Don
Put win-loss findings to work with Brainiac
If your team has the interview data but not the plumbing, that is where we help. Brainiac Consulting designs, deploys and operates AI agents and analytics systems that connect buyer insight to qualification, routing, attribution and forecasting. Engagements can start with an AI readiness and roadmap assessment or move straight to a custom agent deployment for a workflow you have already prioritized.
To see everything we offer across analytics, martech and agentic operations, visit Brainiac Consulting and tell us which deals you most want to understand.
Common mistakes to avoid
- Letting the rep run the interview. Candour drops immediately.
- Sampling only losses. You will fix problems and accidentally break what works.
- Ignoring no-decisions. They are often the largest outcome in the pipeline.
- Over-reading small samples. Treat early themes as hypotheses until they repeat.
- Shipping a report with no owners. Every recommendation needs a person and a date.
- Changing definitions mid-stream. If “qualified” shifts, your ratio trend is meaningless.
- Treating the ratio as the answer. The number prompts the question. Buyers answer it.
FAQ
What is the difference between win loss analysis and a win-loss program?
Win loss analysis is the method: collecting and interpreting buyer feedback and deal data to explain outcomes. A win-loss program is that method run continuously, with scope, owners, a cadence and a path for findings into sales, marketing and product. Programs look at groups of deals for patterns, while a single debrief explains one opportunity.
What does a 2.0 win-loss ratio mean?
It means you win two deals for every one you lose. When only wins and losses are counted, that equals a win rate of roughly 67%. Always state how you handled no-decision deals, because including them lowers the win rate considerably.
Who should conduct win-loss interviews?
Someone who was not involved in the sale. Buyers tend to protect relationships with the people who sold to them, so a neutral colleague or an outside party typically hears more candid answers. Sales leaders should read the results, not conduct the calls.
Should we include no-decision deals?
Yes. A buyer who chooses to do nothing is telling you something about urgency, messaging or the business case. Including a share of these deals in your sample alongside wins and losses gives a more complete picture of why pipeline does not convert.
Can AI run our win-loss program?
AI can transcribe, summarize, tag and surface patterns at a scale people cannot match, and it works best on rich inputs such as call transcripts and clean CRM records. People should still set the objectives, design the categories, review the themes and own the actions that follow.
Sources
- Comprehensive Approach to Win/Loss Analysis, Pragmatic Institute
- Win/loss ratio: What it is and how to calculate it, Competitive Intelligence Alliance
- Customer feedback and revenue growth strategies