
Agent observability is the practice of capturing every step an AI agent takes in production, from model calls and tool calls to final outcomes, so you can explain, audit and fix its behaviour. Splunk’s practitioner guide describes it in much the same terms. The difference from classic monitoring is simple: an agent decides what to do next, so uptime and latency alone cannot tell you whether it did the right thing.
This guide covers what to instrument, what to measure, how logs, monitoring and governance fit together, and how to roll it out without drowning in data.
TL;DR
- Observability for agents means tracing the full chain: the goal, each reasoning step, every tool call, the data touched and the outcome.
- Monitor four things together: quality, reliability, cost and risk. A single dashboard of latency and error rates misses most agent failures.
- Governance and monitoring are two halves of one system. Monitoring shows what happened; governance decides what an agent is allowed to do in the first place.
- Start with structured logs and traces on one agent, then add evaluation, alerts and human review as you scale.
- Treat every diagnosed failure as a future test case.
Table of Contents
- What agent observability actually covers
- How tracing works across steps, tools and workflows
- What to monitor: quality, reliability, cost and risk
- Investigating failures in real time
- Logs, telemetry and audit trails
- Governance: the other half of the system
- Choosing agent monitoring tools
- Perspective
- A practical rollout in five steps
- Common mistakes to avoid
- Put observability to work with Brainiac
- FAQ
- Sources
What agent observability actually covers
Three layers are easy to confuse, and each answers a different question.
| Layer | What it watches | Typical question |
|---|---|---|
| Traditional software observability | Deterministic infrastructure: servers, services, latency, errors | Is the system up and fast? |
| LLM observability | Individual model calls: prompts, responses, tokens | Was this model output good? |
| Agent observability | Multi-step reasoning, tool usage and state changes across a workflow | Did the agent pursue the right goal, use the right tools and reach the right outcome? |
The split follows the Splunk practitioner guide, which separates agent observability from model-level and infrastructure-level views. In practice you need all three. Agent observability sits on top of the other two and connects them.
The reason is non-determinism. The same request can produce different tool sequences on different days. An agent can return a polite, well-formed answer after calling the wrong system, skipping a required check or looping three times before succeeding. Every individual call looks healthy. The workflow is still wrong.
How tracing works across steps, tools and workflows
The core idea is a trace: one record that follows a request from the first instruction to the last action. Inside it, each step is a span. A useful agent trace includes:
- The trigger and goal. Who or what started the run, and what outcome was requested.
- Each model call. The prompt, the model and version, the response and token counts.
- Each tool call. Which tool, which arguments, what came back, how long it took and whether it failed.
- Retrieval. What documents or records the agent pulled in and which it used.
- State changes. What the agent wrote, updated or sent: a CRM field, an email, a ticket.
- The outcome. Success, escalation, abandonment or error, plus any human decision along the way.
Good tracing lets you work in both directions. One practitioner taxonomy describes drilling from business KPIs and user sessions down through agent interactions, tools and model calls to find a root cause. A marketing leader sees that lead-routing accuracy dropped on Tuesday. An engineer follows the trace to a single enrichment tool returning stale records.
Standardize your telemetry
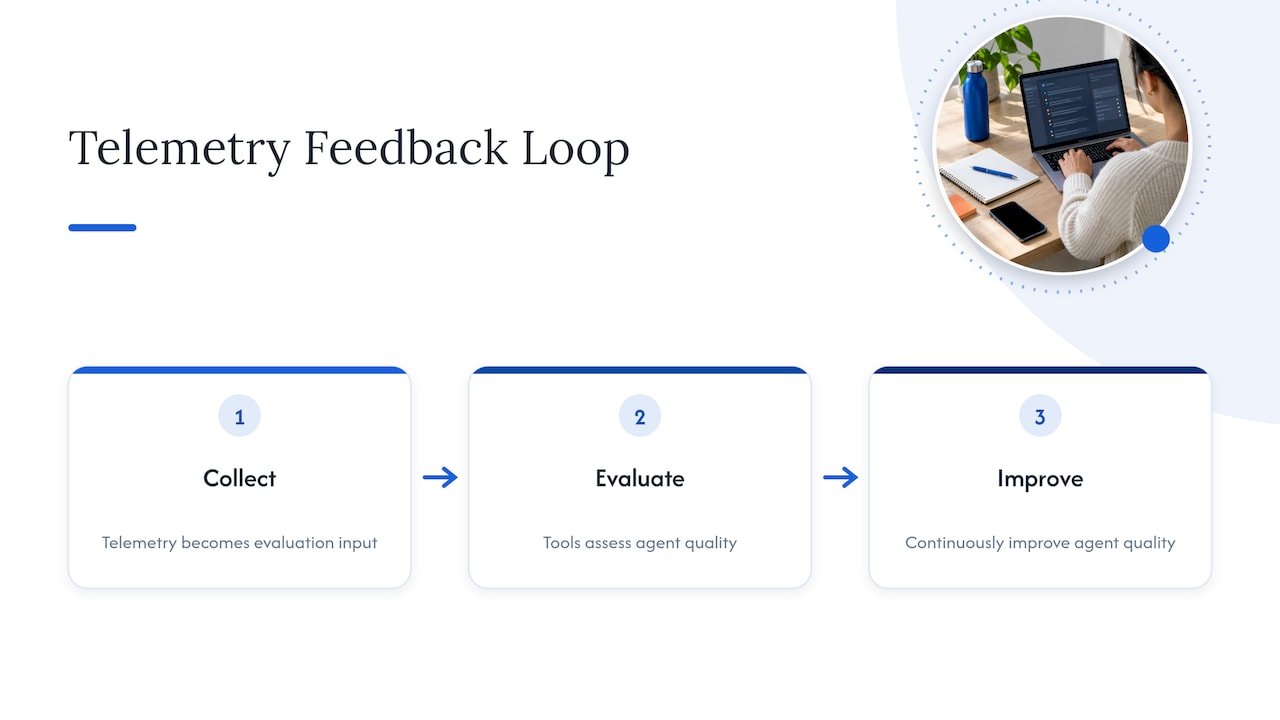
Because agents use many frameworks, shared conventions matter. The OpenTelemetry project has published work on evolving standards and best practices for AI agent observability, and it frames telemetry as a feedback loop: the data you collect becomes input for evaluation tools that help continuously improve agent quality. Building on an open standard also keeps your traces portable, so you are not locked to one viewer.
Pay special attention to tool calls
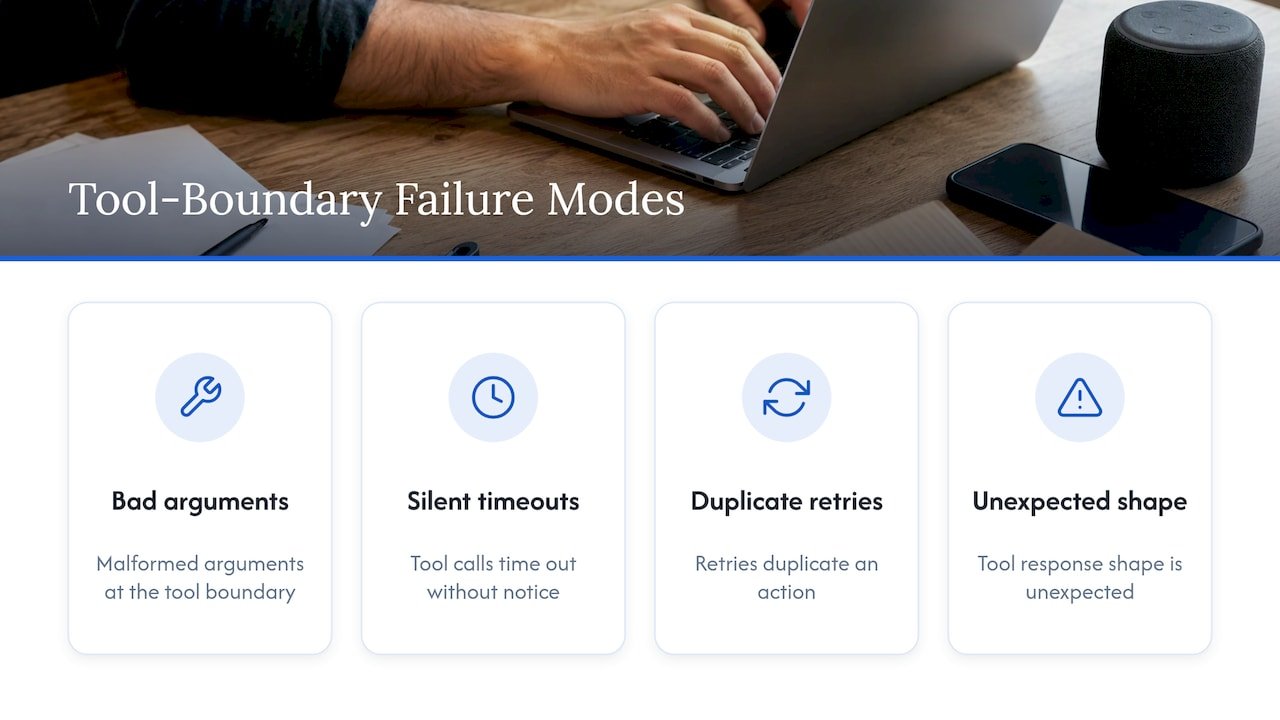
Most production incidents happen where an agent touches the outside world. Malformed arguments, silent timeouts, retries that duplicate an action and unexpected response shapes all live at the tool boundary. If you want a deeper look at how these calls behave at runtime, this walkthrough of agent tool calling in production includes a checklist worth comparing against your own traces.
What to monitor: quality, reliability, cost and risk
Trace data is raw material. Monitoring turns it into signals you can act on. Group them in four families.
Quality
- Task success rate against a defined definition of done
- Groundedness: does the answer rest on the retrieved data?
- Escalation rate and the reasons for it
- Human override or correction rate
Reliability
- Tool error and timeout rates, per tool
- Loops, repeated steps and runs that exceed an expected step count
- Latency end to end and per step
- Drift: success rates or tool-use patterns shifting after a model, prompt or data change
Cost
- Tokens and spend per run, per agent and per business outcome
- Cost of retries and failed runs
- Spend by model, so routing decisions are informed
Risk
- Which data each agent touched, and whether it was permitted
- Actions attempted that fell outside policy
- Sensitive data appearing in prompts, outputs or logs
- Unusual behaviour such as new tools, new destinations or off-hours activity
One note on interpretation: pick business-linked metrics early. Cost per qualified lead or cost per resolved ticket tells a CFO far more than cost per thousand tokens.
Investigating failures in real time
When something goes wrong, speed depends on preparation. A workable routine looks like this:
- Alert on symptoms, not just errors. A spike in step counts, a drop in task success or a cost jump per run often shows up before any exception.
- Open the trace for a failing run. Read it in order: goal, plan, each tool call, each result.
- Find the first wrong step. Later steps often look strange only because an earlier one was off.
- Compare with a healthy run. Same task, different path: what changed in the prompt, tool, data or model version?
- Contain. Reduce the agent’s permissions, route that task type to a human, or pause the workflow.
- Convert the failure into a test. Buyer guides for monitoring tooling stress that diagnosed failures should become test cases so the same regression cannot return unnoticed.
That last step closes the loop between production and evaluation, and it is where observability starts paying for itself.
Logs, telemetry and audit trails
Teams often ask whether ordinary logs are enough. They are a start, but agent logs need structure.
- Use structured, correlated records. Every log line should carry a run ID, step ID, agent ID and version so it joins to its trace.
- Record decisions, not only events. Capture which options were considered and why a tool was chosen, where your framework exposes it.
- Attribute actions to two parties. One practitioner argument is that agents need their own managed identities, with actions attributed to both the agent and the authorizing user in audit trails. It makes later review far cleaner.
- Redact before you store. Prompts and tool results often hold personal or confidential data. Mask it at the point of collection and set retention periods by data type.
- Make audit logs tamper-resistant. Keep them separate from the debugging logs that engineers can edit or purge.
If your marketing and sales data is subject to state privacy law, map it before agents touch it. Our CCPA checklist for marketers is a practical starting point.
Governance: the other half of the system
Monitoring tells you what an agent did. Governance defines what it may do, who answers for it and what happens when it steps outside the lines. The two need to be designed together.
The NIST AI Risk Management Framework organizes AI risk work into four functions: govern, map, measure and manage. Its Generative AI Profile extends that with measures such as pre-deployment testing, incident disclosure and continuous monitoring. Observability is how you supply the evidence for the measure and manage functions.
A workable governance layer includes:
- Enforced permissions. Authorization should be checked at every tool invocation, with the agent’s permissions and resource scope verified before the action runs, not only at login.
- Human approval where stakes are high. Define which actions need sign-off. Our guide to human-in-the-loop approval that actually controls an agent shows how to make the checkpoint real.
- Escalation rules. Decide in advance when an agent hands off. See how to build an agent escalation policy.
- Clear ownership. Every agent has a named owner, a scope and a documented purpose. A job description template for AI agents helps with that.
For the full approach, see our AI agent governance implementation framework.
Choosing agent monitoring tools
The market includes open-source tracing libraries, evaluation platforms, general infrastructure monitoring suites with AI modules and security-oriented inventories of agents. Rather than naming vendors, compare by capability. One buyer’s guide lists the key ones: real-time drift and anomaly detection, cross-agent dependency mapping, decision-level audit trails, policy enforcement and remediation, and cost monitoring.
Use this checklist:
| Capability | Why it matters |
|---|---|
| Full trace capture across LLM and tool calls | Lets you find the first wrong step |
| Open telemetry standards support | Keeps data portable and avoids lock-in |
| Evaluation tied to production traces | Turns failures into regression tests |
| Drift and anomaly alerts | Surfaces silent degradation |
| Cost attribution per agent and outcome | Connects spend to business value |
| Access control and redaction | Protects sensitive data in the telemetry itself |
| Integration with your stack | CRM, marketing automation and BI tools should show agent activity next to business results |
The last row is often overlooked. Agent telemetry that cannot be joined to pipeline, revenue or support data stays an engineering curiosity.
Perspective
We build and operate AI agents for marketing, sales and finance teams, and the pattern is consistent: agents rarely fail loudly. They fail by being quietly plausible. A lead gets enriched with the wrong account, a forecast leans on a stale field, and nobody notices until the quarter closes.
That is why we insist on open, visible builds. When an agent runs inside your environment, on your systems, with traces you own, there is no black box to take on faith. Observability is how you keep an agent honest, in the same way attribution is a map rather than a courtroom verdict: it shows you the terrain and lets you make better decisions, rather than handing down a single answer.
Our advice is to design observability and governance before launch, not after the first incident. Shadow the agent against human work, define what good looks like, and let the telemetry earn the agent its autonomy step by step.
Don
A practical rollout in five steps
- Pick one agent and one outcome. Narrow scope makes signals readable. Our view is that engineering teams should start with one agent until they need more than five tools.
- Instrument before you scale. Add trace IDs, structured logs and tool-call capture from day one.
- Define success and failure. Write the rubric: what counts as a correct outcome, an acceptable escalation and an unacceptable action.
- Run in shadow mode. Compare the agent’s proposed actions with human decisions before it acts on its own. Our deployment approach with shadow validation and governance follows this pattern.
- Review weekly, then expand. Look at failures, cost and overrides. Add alerts for what you learned, then add agents.
If agents feed analytics or reporting, validate the numbers too. This guide on judging whether an AI analytics platform is accurate enough applies the same discipline to outputs.
Common mistakes to avoid
- Logging everything, reviewing nothing. Volume without a review cadence is storage cost.
- Watching only the model. Many failures live in tools, data and permissions.
- Skipping business metrics. If you cannot link agent runs to outcomes, you cannot defend the programme at budget time.
- Storing sensitive data in traces unredacted. Your telemetry becomes a new risk surface.
- Treating governance as a document. A policy that is not enforced at the tool call and visible in the trace does not govern anything.
Put observability to work with Brainiac
If you are deploying agents for revenue operations, marketing or finance and want them visible, governed and tied to business results, we design and operate them with you. Our custom agent deployment work covers production-grade agents that run inside your environment, built openly and integrated with platforms such as Salesforce and HubSpot.
Not sure where to start? Our AI strategy and readiness advisory maps opportunities, sets guardrails and builds the roadmap, and you can see the full range on the Brainiac Consulting site.
FAQ
What is the difference between AI agent monitoring and observability?
Monitoring tracks known signals such as error rates, latency, cost and success rate, and alerts you when they move. Observability gives you the traces and context to explain why they moved. You need monitoring to notice a problem and observability to diagnose it.
Do I need special tools to monitor AI agents?
Not necessarily at the start. Structured logs, trace IDs and a basic dashboard on one agent go a long way. As you add agents, look for tools that capture full traces, support open telemetry standards and connect production failures to evaluation.
How does agent observability support compliance?
It supplies the evidence: who authorized an action, what data the agent touched, what it did and whether a human approved it. Pair it with enforced permissions and retention rules. Your legal team should confirm which regulations apply to your data and industry.
What should I log for an AI agent?
Log the run and step IDs, agent version, model version, prompts and responses, tool names, arguments and results, retrieved sources, state changes, escalations and final outcome. Redact personal and confidential data before storage and keep audit logs separate from debugging logs.
Who should own agent observability?
Shared ownership works best. Engineering or operations owns instrumentation and alerts, the business owner of each agent owns the definition of success, and security or compliance owns policy and audit review. Name one accountable owner per agent.
Sources
- What Is AI Agent Observability? A Practitioner Guide (Splunk)
- A Taxonomy of Agentic Observability for Large-Scale AI Deployments
- AI Agent Observability: Evolving Standards and Best Practices (OpenTelemetry)
- The architecture of governable AI agents (WorkOS)
- What to look for when evaluating AI agent monitoring tools (DataRobot)
- AI agent monitoring tools: A buyer’s guide for production (Latitude)
- Overview of Risk Assessment and Management for Intelligent Systems under the AI Act and Beyond (NIST AI RMF summary)